Atlassian Portfolio 2.0 Demo

In August, 2016 we held a private live webinar for our clients. We have had a lot of interest in Portfolio and decided to publish video of the webinar and a transcription here, in this post. Some minor editing of the text has occurred to assist with the flow.
Michael: Welcome to our Portfolio 2.0 demonstration and discussion. We are approaching this from questions our clients have. So, we’re really attacking this, not from a full-feature list perspective but from how it applies to the client systems that we work with.
So, a little bit about us…
We provide classes in the use of Atlassian products. We offer JIRA Boot Camp, Atlassian User Academy, Confluence Boot Camp, and we also provide a private, customized combination of consulting and training, where we do a customized curriculum based on the environment of that particular customer. We probably do more of those than the others we list.
We also provide, as an extension of that customized consulting curriculum, some project management consulting. We do integration of systems and configuring of large systems at scale, bringing it in under the enterprise umbrella. A very common use of our skills is pulling together multiple instances that have sprung up across a company into a single enterprise instance. Migrating that data is something that we are very good at.
Expium also builds custom and marketplace add-ons. We usually build these in support of the projects that I just referred to, where we’re needing to move data around. We’re needing to add features, and because we’re also a software development company, we typically just build those tools. Because we’re a software development company that builds enterprise software, we also work with continuous integration, building build-server environments, automated testing, automated deployment–the whole cycle. And we can attack enterprise projects at a complex scale.
So, Portfolio 2.0. There’s a history. We’re going to talk about that. We’re also going to define some important terms and concepts. We’re going to do a live demonstration using data that we’ve put together to be realistic and actually show the capabilities of the system and then have a little bit of a discussion and a Q&A at the end.

To set up our environments, we just go get a free cloud instance of JIRA and Portfolio, and then we use our own free data generator for JIRA. It’s called Jumble for JIRA. We built it a couple of years ago, and we keep it up to date with the latest versions. In fact, we’re working on an updated version that will have data that is better to use in Portfolio and Service Desk, and that should be updated in the coming weeks.

The back story… There was an initial need for project management planning at scale. There has always been this tension with JIRA of management wanting a Gantt chart out of a tool that’s built to manage work as it’s actively being done.
So a couple of customers were really demanding this, and it’s our understanding that that drove the creation of Portfolio 1.0 along with some external development efforts. And the first version was really, I would say, an alpha version. It only worked in a very narrow use case, and although it was attacking a very complex set of problems, it had not had enough time to mature into a complete solution. So, our conclusion regarding Portfolio 1.0 was that it was not ready for prime time, except in a very narrow use case. And we did not find any of those use cases within our customer base. We did try it with some customers, and it just was not able to do what was needed.
So, I know Atlassian saw this as well within the larger customer base, and so they went back to the drawing board with Portfolio 2.0. And what we have seen so far out of the product is extremely encouraging, and it seems to have a lot of application and a lot of benefit for the enterprise. And the larger the system, the more projects that there are, the more complex the needs, the better Portfolio fits.
We’re seeing this as an exciting shift. And there’s some neat concepts, some great concepts that are coming into Portfolio 2.0 that have benefit for the enterprise.
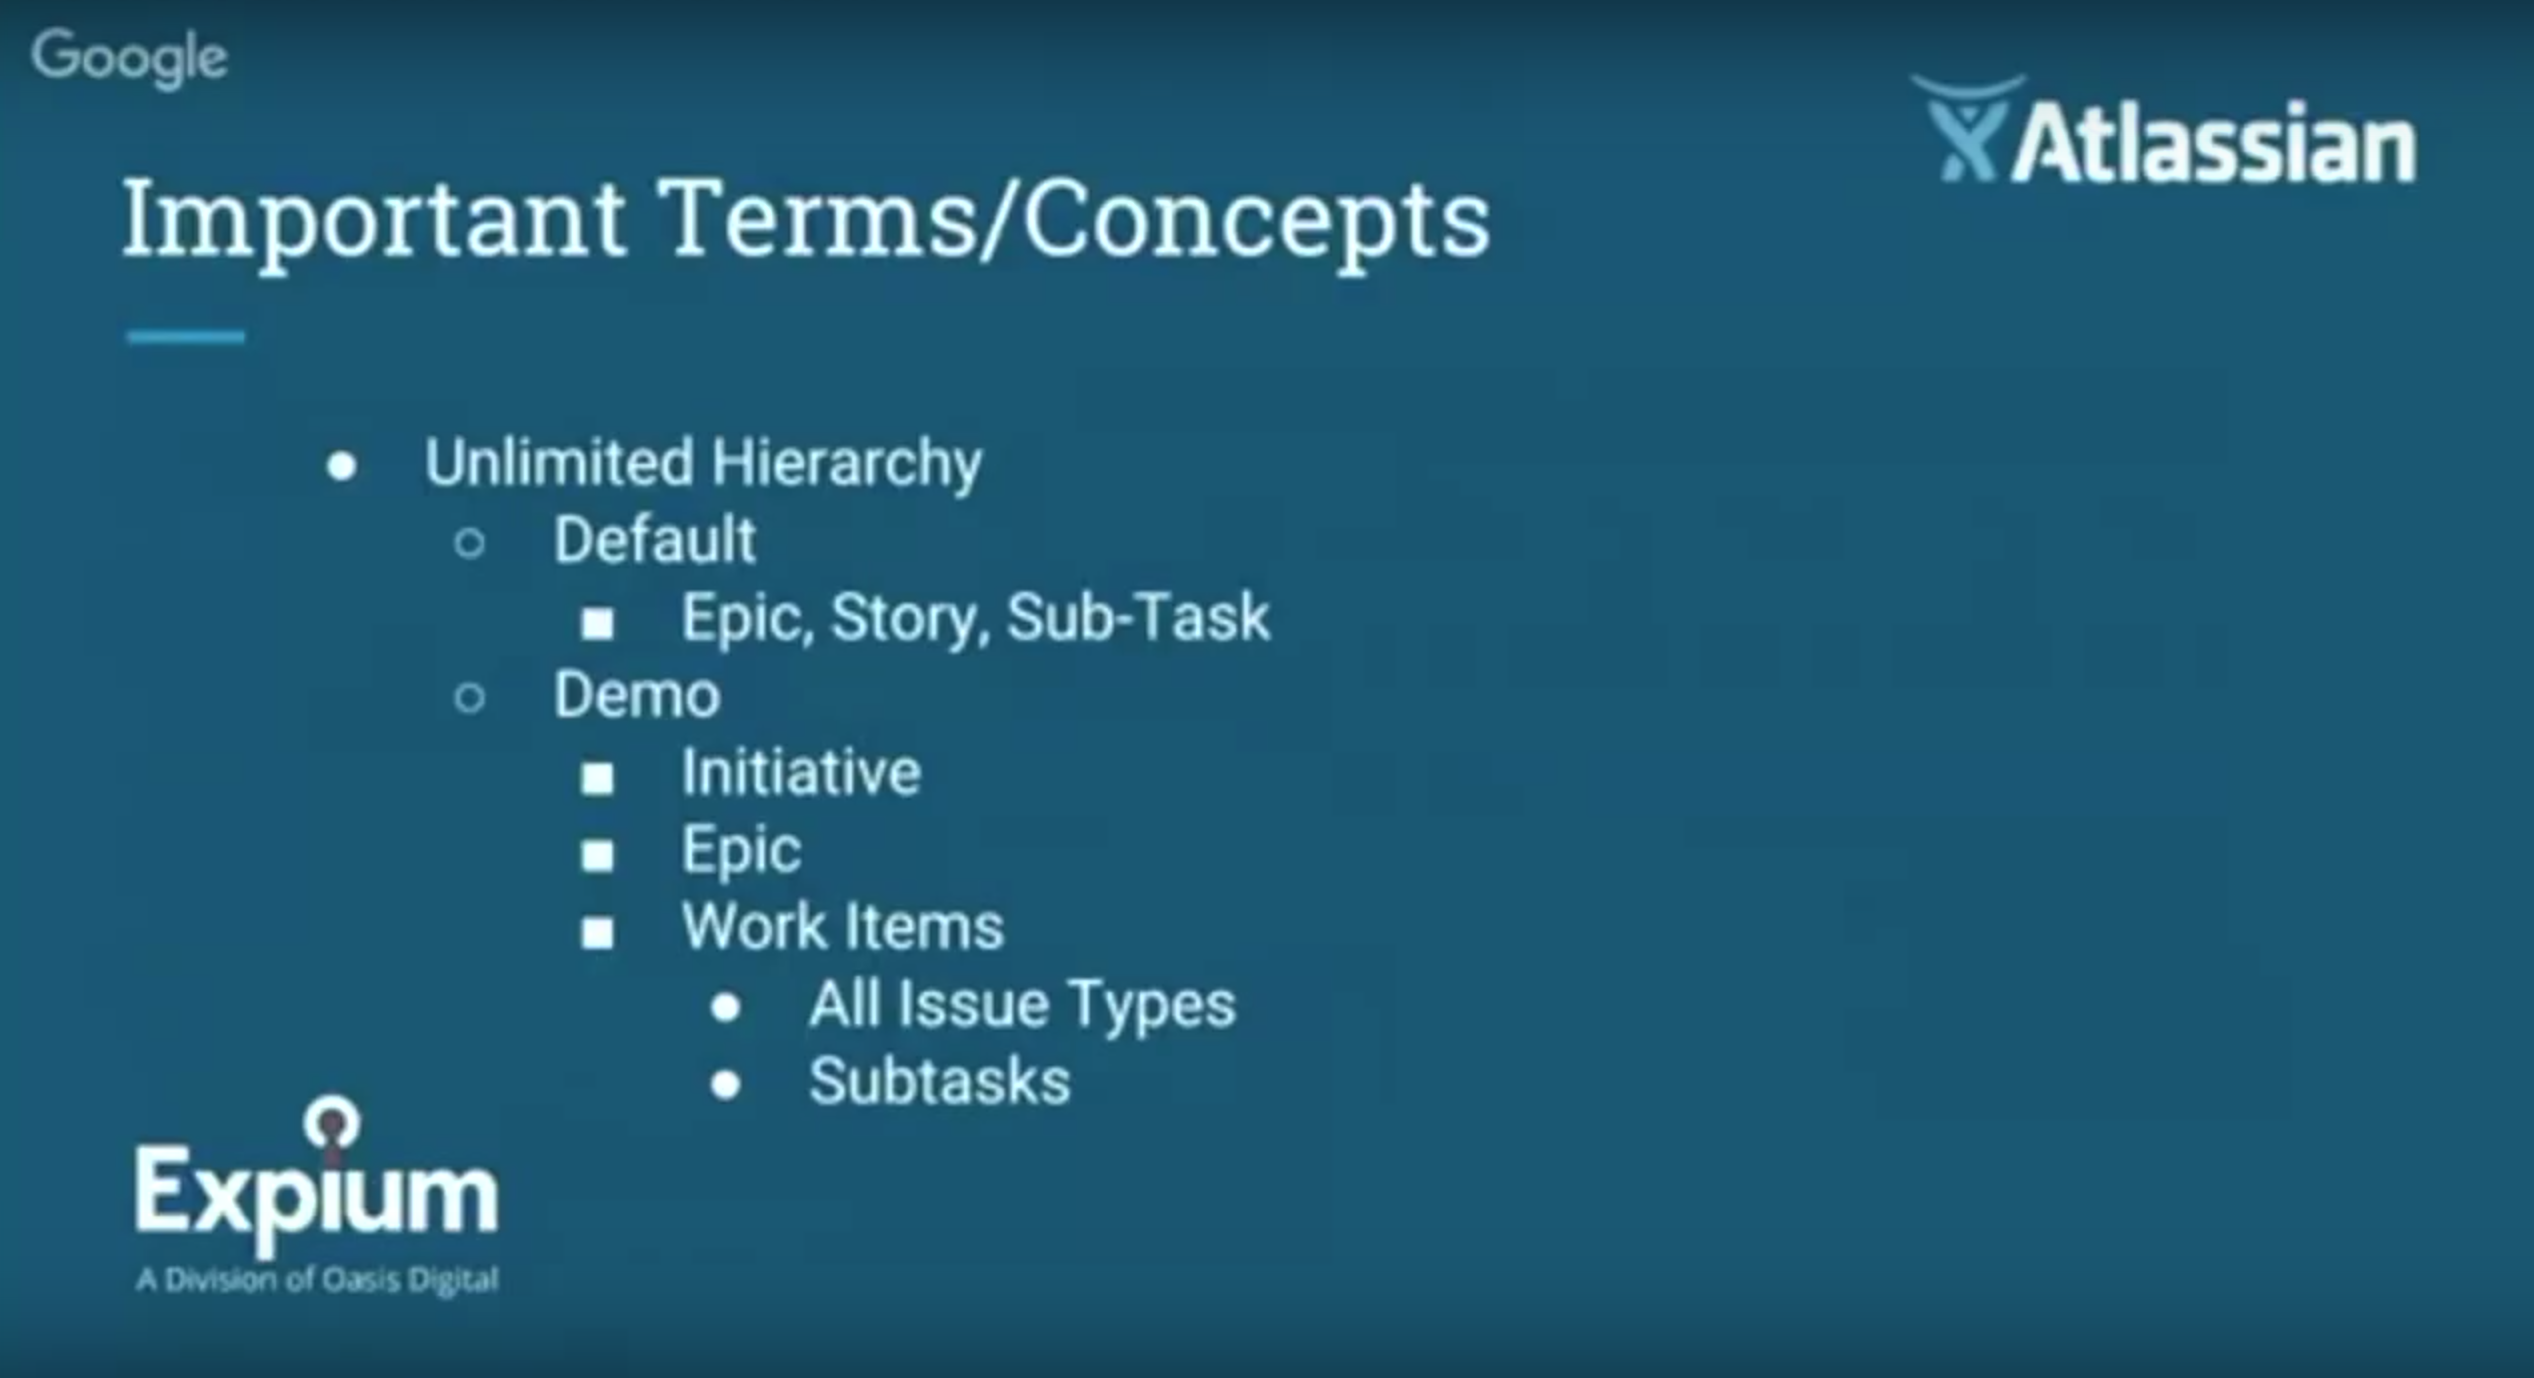
So, we want to talk about a few important terms before we get into the actual demo. We have, within Portfolio, there is now an unlimited hierarchy. Those that are familiar with JIRA know that, really, right now, your hierarchy consists of task and sub task, or item and issue type and sub task issue type. And there’s very little that you can do otherwise, other than creating links between items. So you can kind of create your own false hierarchy with that process. And you can actually extend the hierarchy a little bit by having projects that span other projects. And we can go into that on another talk.
The default within Portfolio is a three-level hierarchy, but there’s the opportunity to make as many levels as you want. And we’ll show you where you do that in the demo. The default is epic, which contains stories, and those stories contain subtasks. For the demo, just to demonstrate that there was more flexibility, we added initiative which contains epics, which contains all the work items, and some of those work items can be stories, even though we didn’t do that in this particular example.
And the work items consist of all issue types and their subtasks. So, there’s kind of three levels or three views of the data, so to speak. But you can have as many as you want, depending on your organization’s needs.
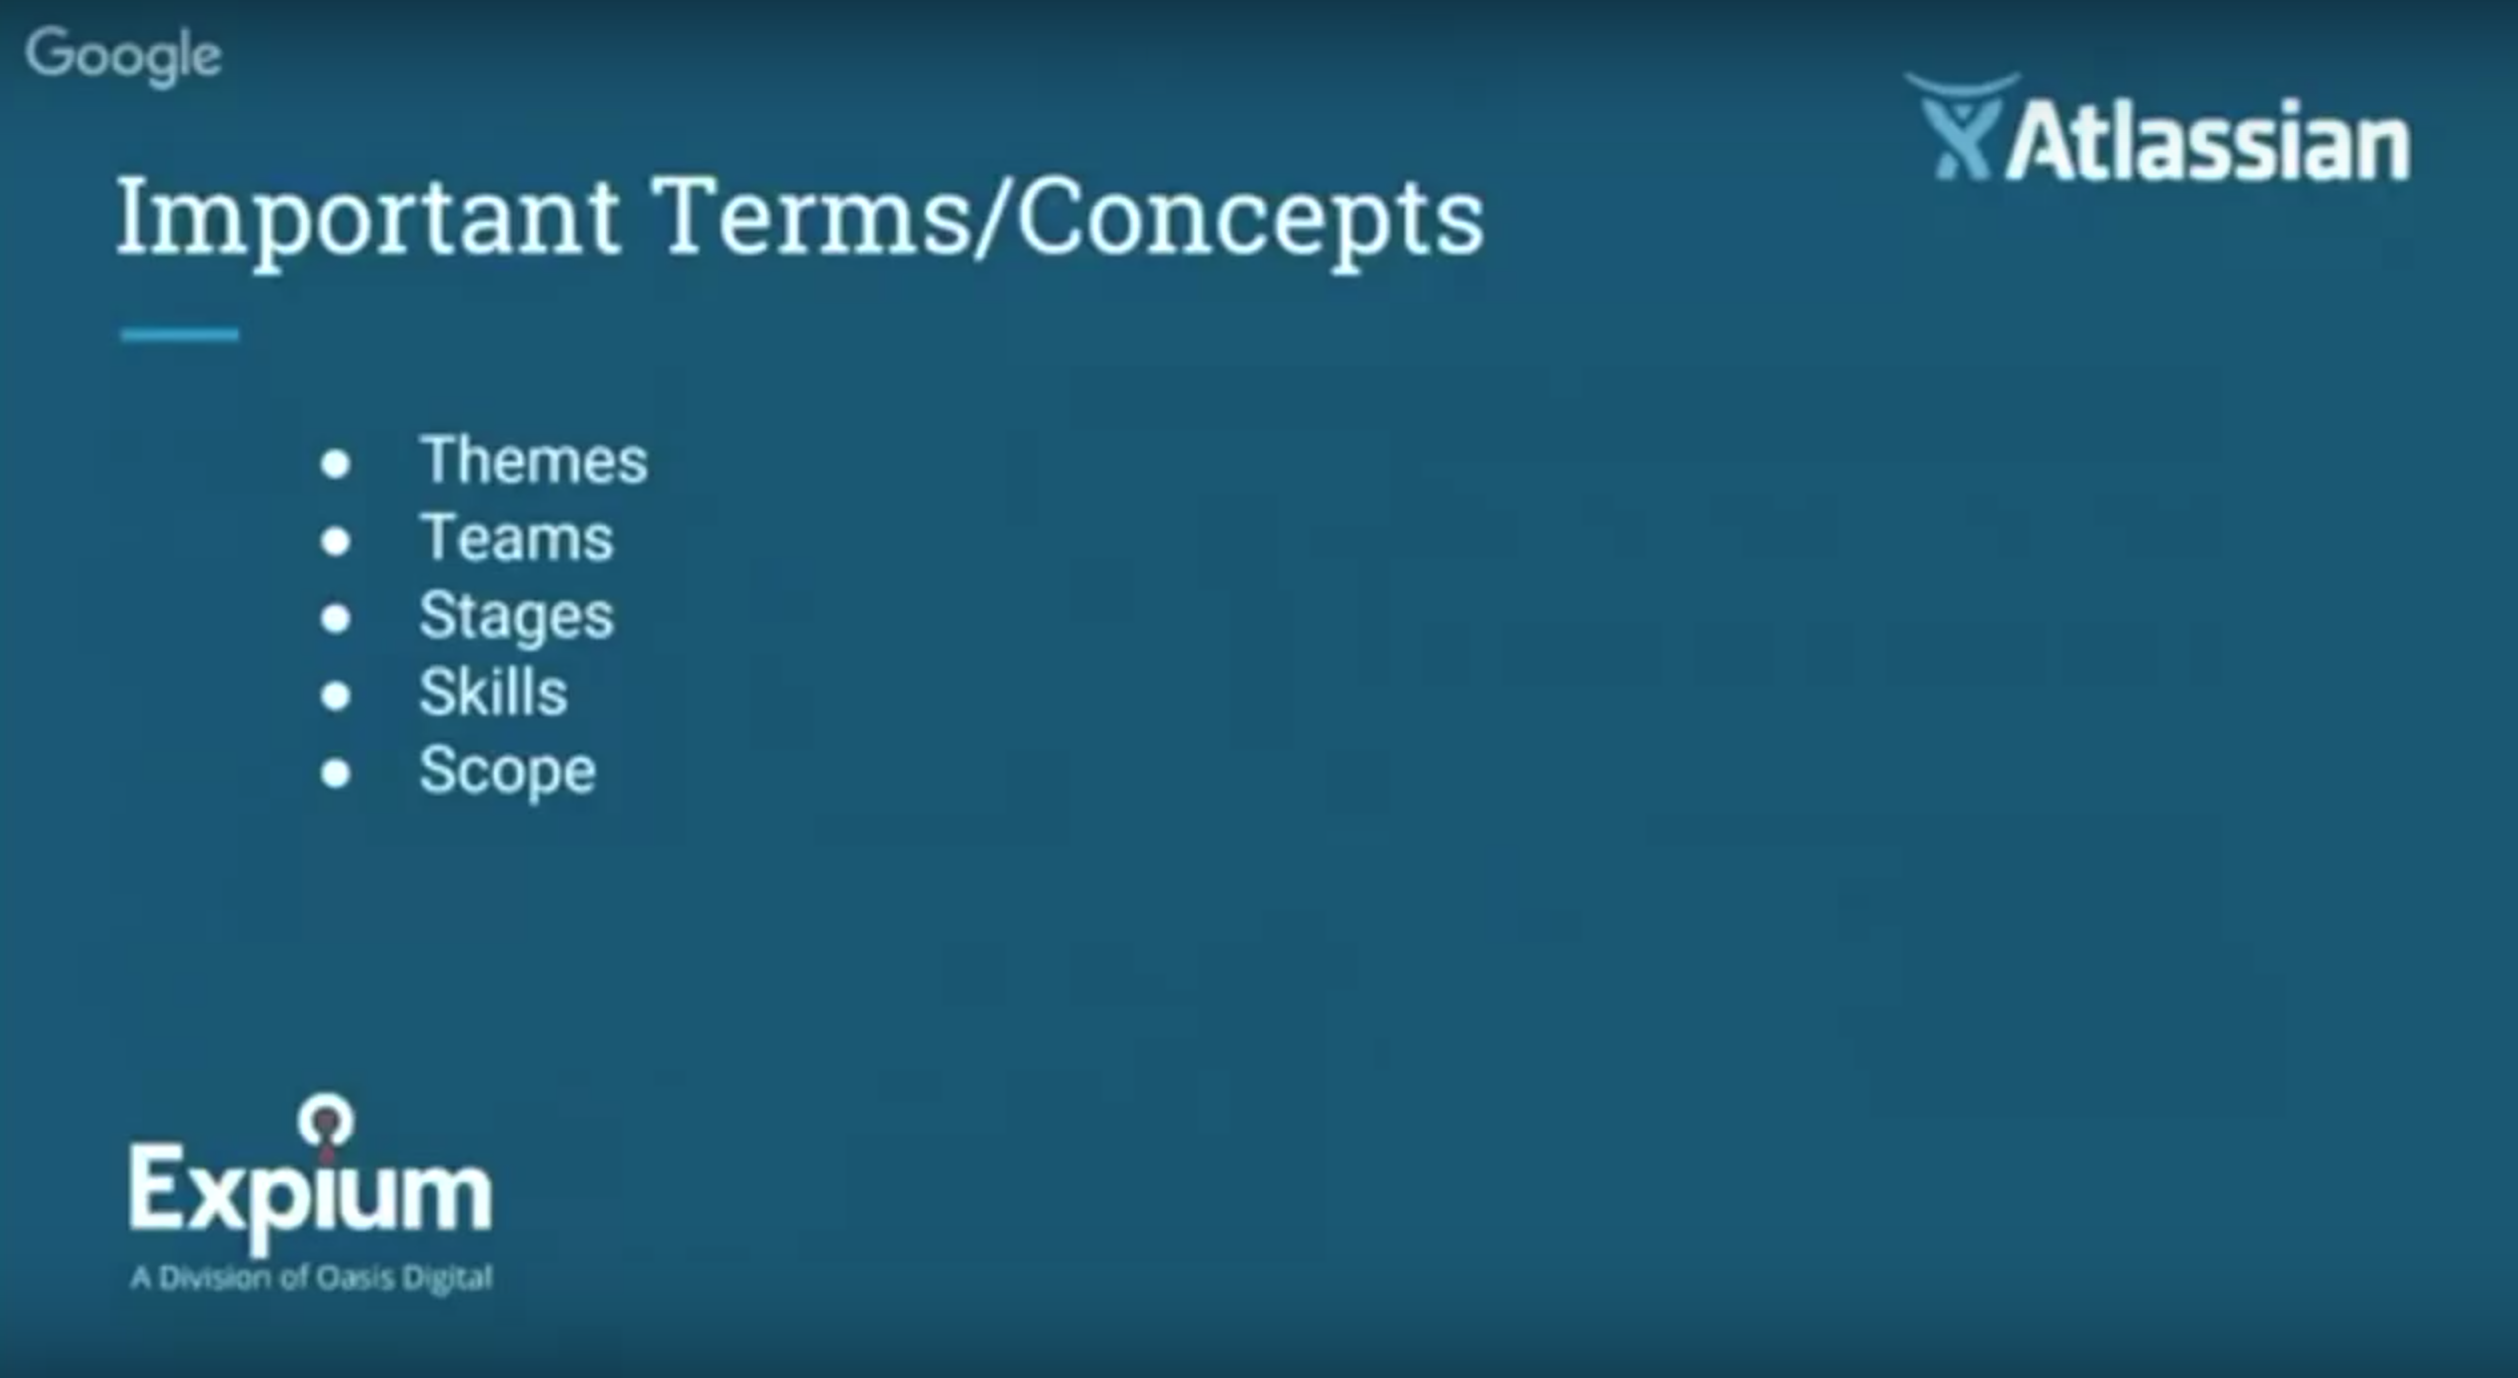
There are also some other terms that are really important. There’s the idea of Themes, which is introduced here in Portfolio. The best analogy I’ve found for them in the JIRA environment, is Components. When you look at Components in JIRA, they kind of slice across the data and a project in a different axis. Themes slice across the data in a completely unrelated axis to everything that’s going on in the system.
So, for example, we set up in ours, the Themes are a corporate initiative idea. So, we have sales; we have support; we have operations; we have customer experience — those four categories where we want to measure our team’s effort, pushing forward those corporate ideas, or those corporate priorities. And this allows a company, an enterprise, to directly connect the work being done by the teams to the corporate initiative. And this can be very important, even at the shareholder reporting level.
Then also, within Portfolio, we have this idea of Teams. In JIRA, you have one person assigned to an item at a time. It can move between people as it’s worked on and goes through its life cycle. And that’s all fine. But there’s not a good way to understand how that happens and why that happens. That’s why they’ve added the idea of Teams in Portfolio. And then, tied to that are Stages and Skills. Stages are what I just referred to. It’s the life cycle of a work item.
So, in software development, it could be the design of a work item rolls into the development. And then there’s testing and documentation. And there might be a percentage of the work of the estimate that’s assigned to each of those. Well, those Stages of development or Stages of work completion are built into JIRA Portfolio and allow you to automatically break that up and then understand where the Skills are in your Team.
So, if there’s 100 hours on an item, and you have 10 hours of design, then you need to have somebody on the Team assigned the Skill of design to be working on that part of the item for it to make it into the schedule. So, each Stage can have multiple Skills associated with it, as many as you need. And we’ll be talking about that a little more.
So this idea of Teams and then the Stages of work and then the Skills of the Team are very important in Portfolio and provide some great information.
The Scope is the span of what you’re analyzing or looking at. So, it could be based on date ranges. The Scope could be across multiple projects, but the idea is what window of the data are you looking at. And your Scope could be everything in the system, if you wanted it to be.
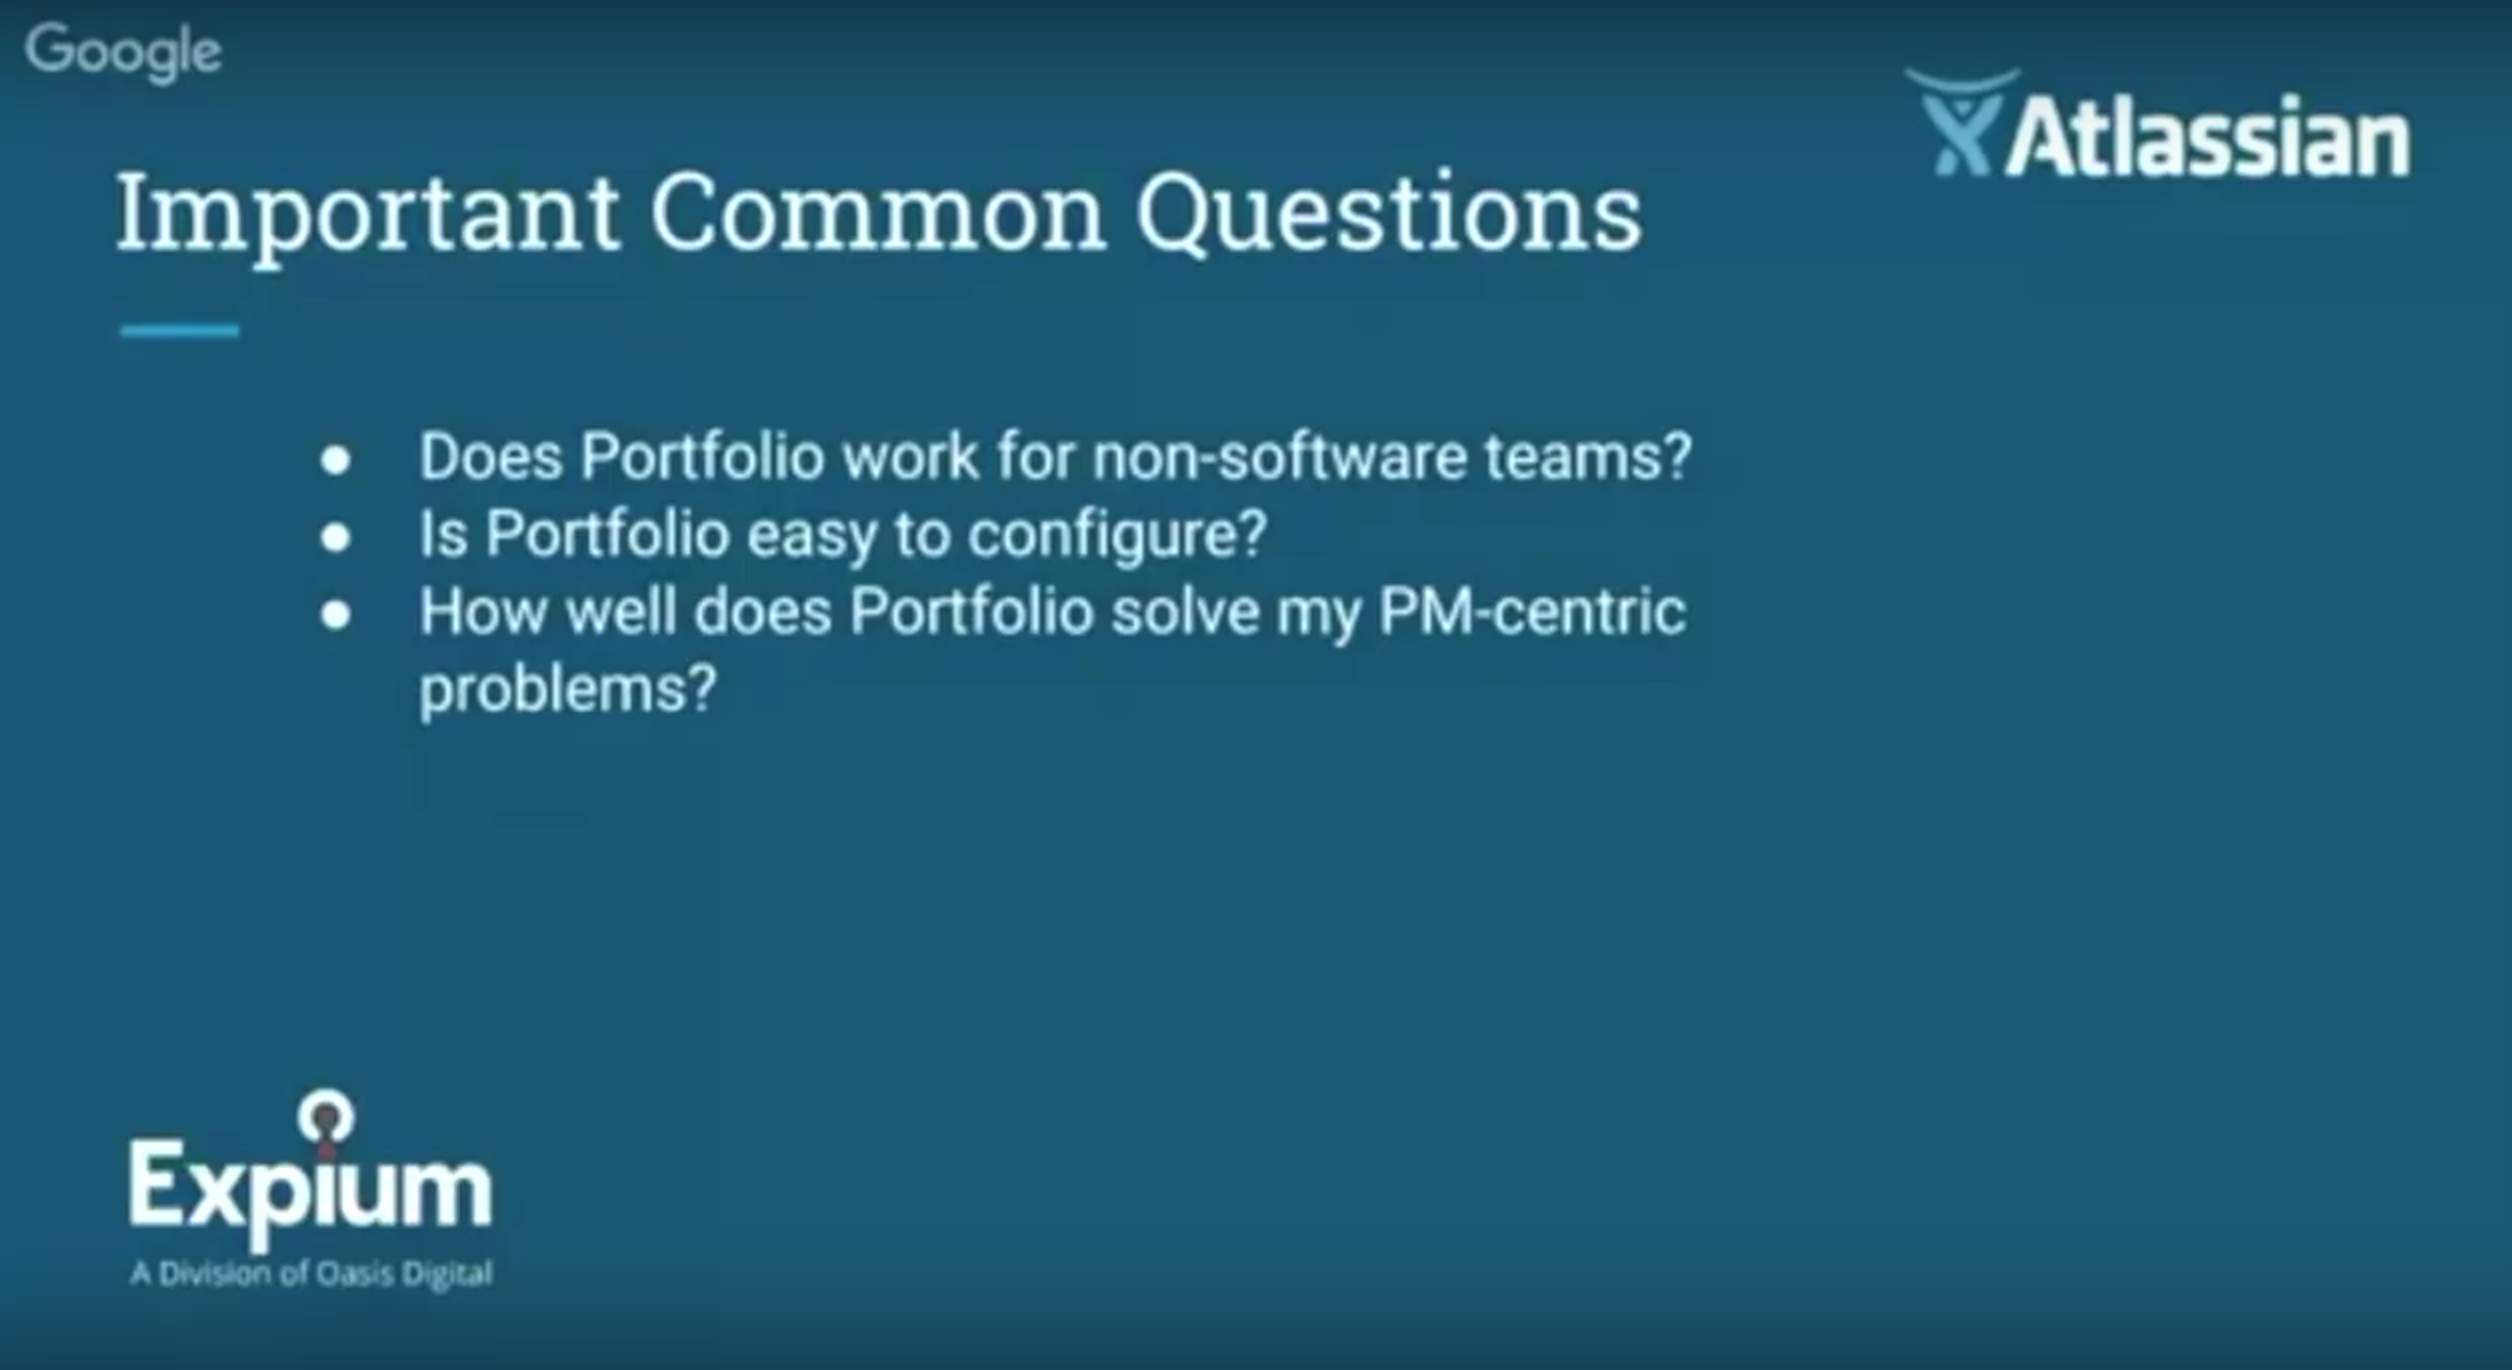
So, we have some important common questions, the first one we get — and this is primarily coming out of the experience with Portfolio 1.0, and the question is, “Does Portfolio work for non-software teams?” And the short answer is, absolutely. And that is a great answer to be able to give. I think this is a very good tool for non-software teams.
And then, “Is Portfolio easy to configure?” Unfortunately, the truthful answer is no, and we’ll be talking a little bit about why in the demo. There’s five, six places within the system that you configure, and you also have to work with your data to get it into a shape that it can be used.
Now, this is not a surprise. This is an enterprise-level reporting and planning tool. And so there’s a complexity here that’s just going to require a level of expertise that many customers don’t have. So, many customers are going to need help getting their data in a shape that can be used in Portfolio. But once that happens, it should continue to work ongoing.
And then, “How well does Portfolio solve my project management-centered problems?” It does a really good job at a subset of problems, especially related to scheduling, capacity, staff, managing, dates. It does not handle any costing whatsoever. So, if you have a need for costing, you need to have a supplementary tool in addition to Portfolio.
So, now let’s move on. I’m going to move to the live demo, and then we’ll get to questions after that.

So, what I’ve done here is I’ve actually launched Portfolio from the menu above, and I selected a plan that I created specifically for this demo. I can create a new plan, and I will show you that process towards the end, after some of the selections make sense. The first time you go through the creation process, it just doesn’t make any sense. You end up throwing away, essentially, your first one, very much like we see users struggle with workflows for the first time when they’re going through class. Usually the first workflow somebody builds is completely unusable.
So, the basic screen that you see here — and I do want to make a comment–Portfolio is built for very large monitors. For this presentation, we can only use a standard-size monitor just so it’s readable and referenceable. Know that we will not be able to get everything on the screen. If you have an oversize monitor, this works very well. This will obviously make sense to anybody who has used a lot of project management tooling, being able to see the breadth of the entire space really gives you a different view. And that is the case with this tool as well.
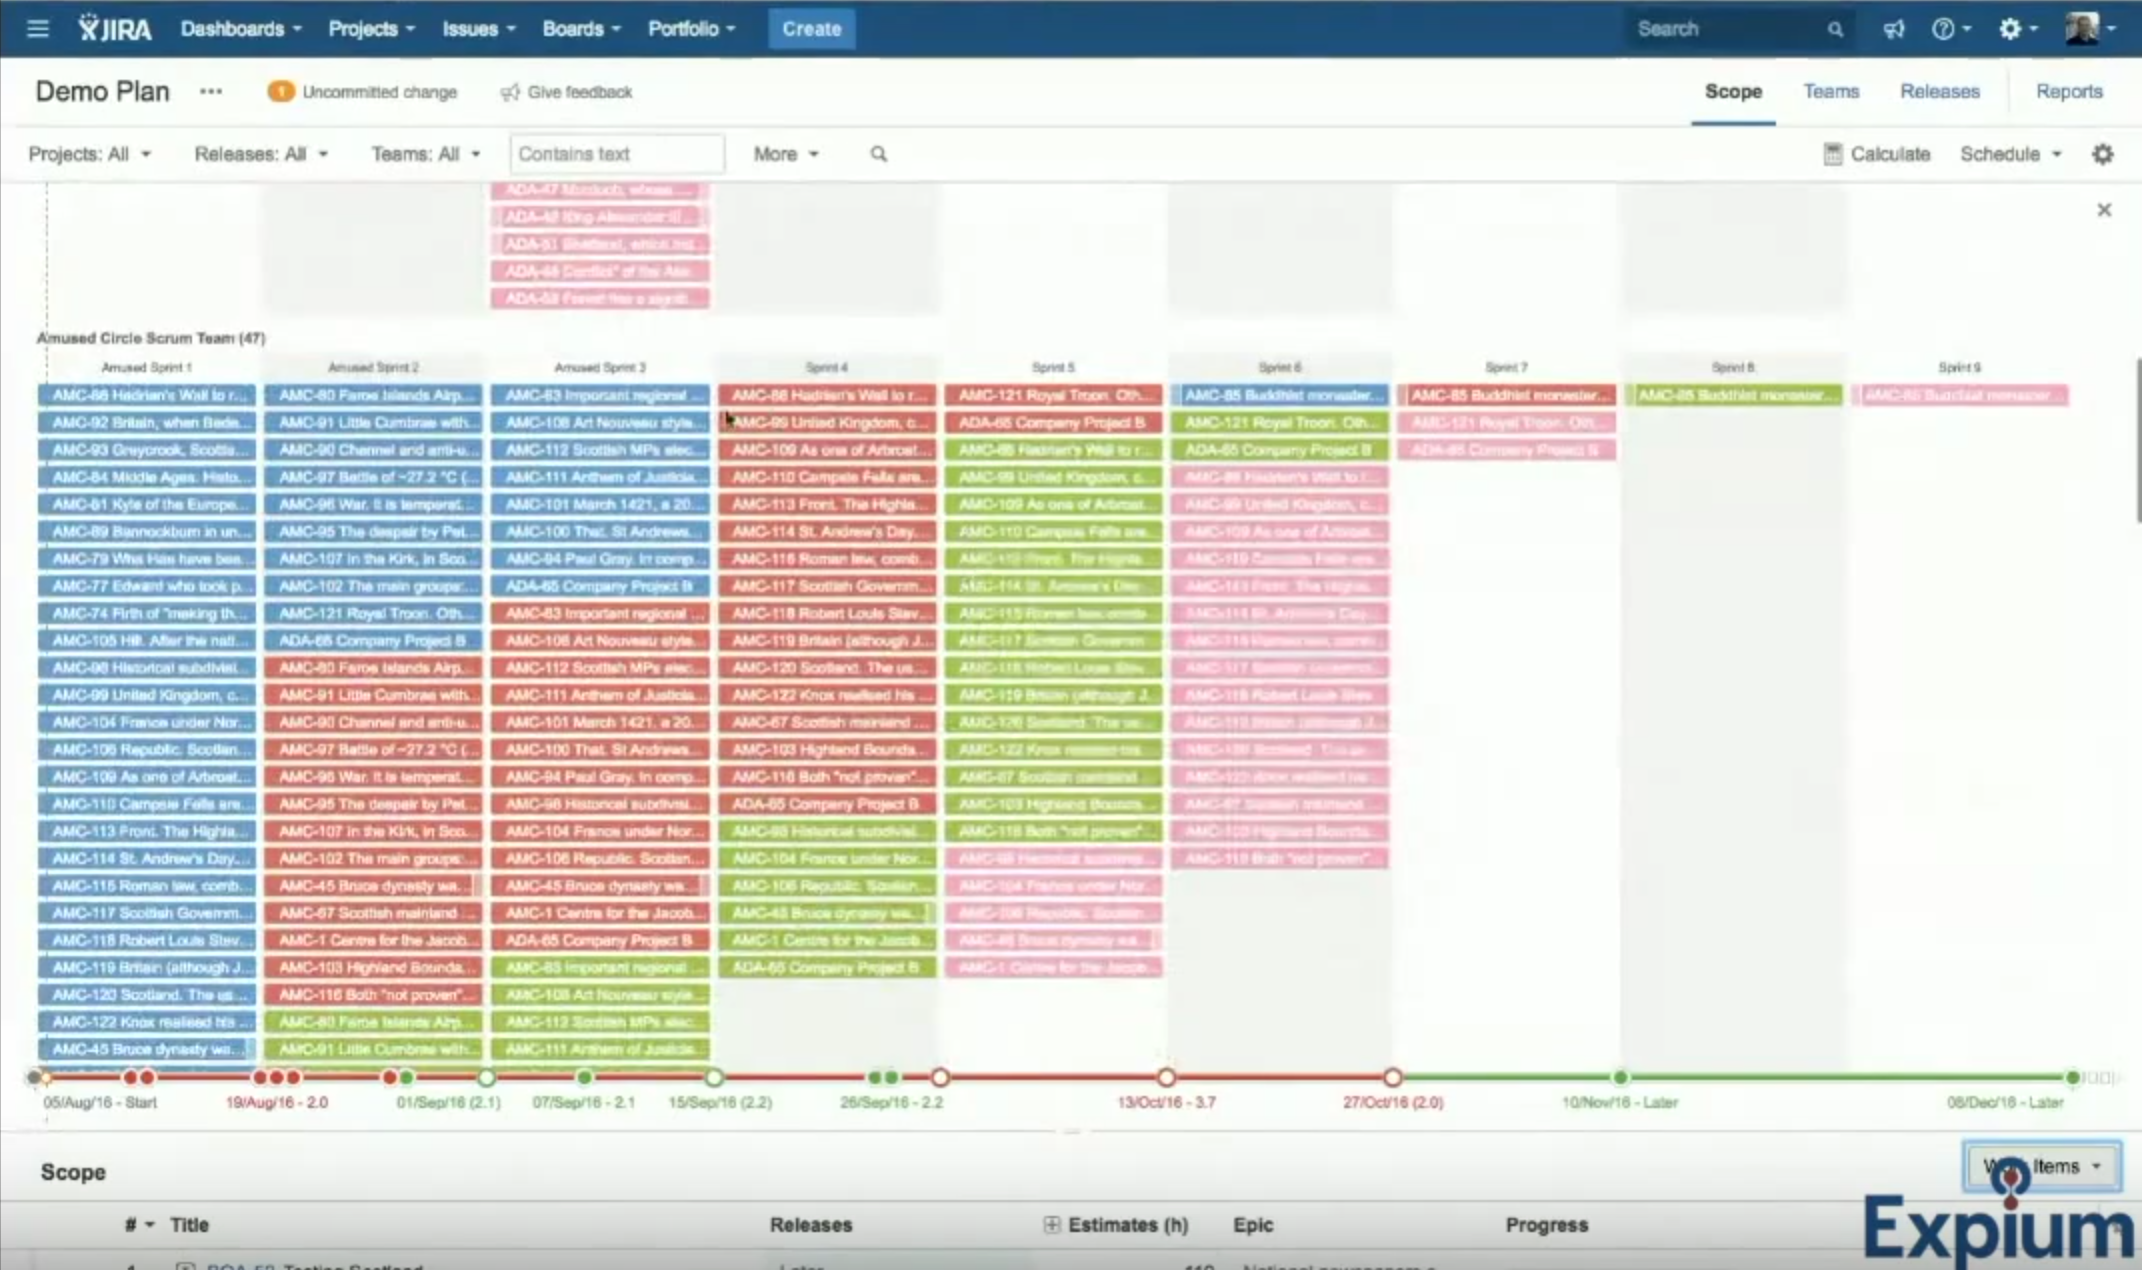
So, the window is essentially broken up into two panes. And you saw me drag this right at the beginning. There’s the bottom pane, which is configured independently of the top, and then there’s the top pane. And so, I’ve got the ability to adjust this for my own purposes. The top pane defaults to a kind of timeline view.
What you see referenced down here are various versions. We still have a lot of software development data inside this to show some of its features. This will show you some of the version and planned releases, etc., that you have on your roadmap.
And then we have the issues here shown in a timeline format based on the number of hours. In this case, that are estimated for them.
The bottom pane is essentially a list of the items at the particular level of the hierarchy that you’re viewing it. In this case, we’re looking at epics. And there is a list of epics here, and we will walk through more detail on this here in a minute.
So, one thing — there’s the normal navigation. I can actually do some filtering up here based on projects, based on particular releases, based on particular Teams that I have set up for this particular plan. One thing I want to point out is there are a number of places to configure Portfolio here in this view. There are actually four, I think, that we know of.
So, under this ellipsis here, I can configure the settings for this particular plan. And then, under the Portfolio menu here, I can administer Portfolio, which also has a number of settings that will impact this plan.
Under this gear icon here, I have the settings for the top pane, and down below, I have the settings for the bottom pane.

When you’re using this tool, sometimes it’s very easy to get disoriented as to what setting is where. I’m going to go through these one at a time real quickly here. First, there’s some plan configuration settings. And you start to see these as a part of the setup process. So, here’s where you set up the Stages and Stills. And remember, these are the stages that an item goes through, and it’s almost like a workflow. So, there’s the design element of an item, the development, the testing, and the documentation.
I can set the percentage of the hours that are estimated for the project that will be broken out as a part of this, and we’ll see this again two or three times as we go through. But I’ve said that if there’s 100 hours estimated for the item, 15 of those hours will be allocated for design. 50 of those hours for development, 25 hours for testing, and 10 hours for documentation.
Now, within the 50 hours for development, I will have those broken up into four Skills. So it will be 12 ½ hours for each of these skills as a part of the estimating process.
Skills in the Stages are also important, because you can assign a particular Skill or the group of Skills to a particular Team member. To complete any item, within that Team, you have to have somebody with each of these Skills. And that comes into play as we look forward through the application.
There’s also the idea of scheduling. There are some basic settings here, nothing that we need to go over in detail right now. There are items that you’ll need to tweak as you work through the process. There are the typical working days. So, we can set how long our workdays are, which days of the week we work. We can add some specific holidays and non-working days so our estimates are good and our projections are good.
We have issue Sources. In this case, I built four Scrum teams within this instance and created this plan based on the work assigned to those four teams.
And then there’s an additional Commit setting here, which is not that important. What’s important is the idea of committing. So, I’m going to go back to the plan. This is a mechanism where you can try ideas and see how they impact the overall projects, see how they impact the delivery schedule versions, the load on the teams in various sprints, without committing them to JIRA.
So, for example, if I say this is estimated in JIRA at 110 hours, but I think they’re way off. I need to add another 40 hours to that, and I hit enter. Now it flags me right here that I have a change. And then at the top, it tells me that I have one uncommitted change. This uncommitted change is represented in Portfolio, but it’s not represented in JIRA, very much like you would handle source control.
So, I need to commit this change before it would actually roll to other users within the system. But I can make changes from here, and I can edit the system. Also, if there are changes that I make within JIRA, or I make changes here, the top pane does not automatically recalculate. The dependencies do not automatically recalculate. I can manually do that by clicking this [Save Changes] button.
The idea being, when we were making changes to this, we had a couple of hundred uncommitted changes built up. So you can do a lot of playing around. You can actually have three people take a look at this independently on plans with the agreement that they won’t commit those changes, and then actually compare the plans and see whose plan works the best. So, it gives you an ability to actually scale the problem solving.
So, that is just the configuration here under the plan. There is also some very important configuration here, under the Portfolio menu and in administration.

The most important — we can set permissions — but the most important item here is the hierarchy. So here, you can create a new level in the hierarchy, and you can assign an issue type to it. So, in this case, I have Initiatives that are above Epics, and then all the other issue types, including sub task issue types, down below that. And there are some other settings here we won’t take time on right now.
We’ll go back to the plan… Now I can start looking at the actual panes, the data that’s here. Notice I still have the one uncommitted change. By leaving, I did not make some decision related to that.
So, this top pane, as you can see, I’m going to go ahead and drop this down so I can see more of it. These are all of my epics. I can change my view to be the work items. So, I can see many more items here in this view. Right now, in this view, it’s selected that it’s showing me the work items as they’re assigned by sprints that are assigned within JIRA.
Now, I have control up here. I’m now looking at it as a Team. I could look at it by individual. And the colors right now are related to the Stages. So, development, for example. These are all color-coded based on development, design, testing, and documentation.
And I can look by individual and see how many items they have assigned to them, which Stage of the project they’re on. And there’s quite a bit I can do there. I can remove the sprints idea and just see these based, again, on time. So, now I’m looking at them on time. But now I can look at them according to the Themes, and I’m going to show you more about that here in a minute, what these Themes mean. In fact, why don’t we do that right now? I’m going to go ahead and jump so this makes more sense.
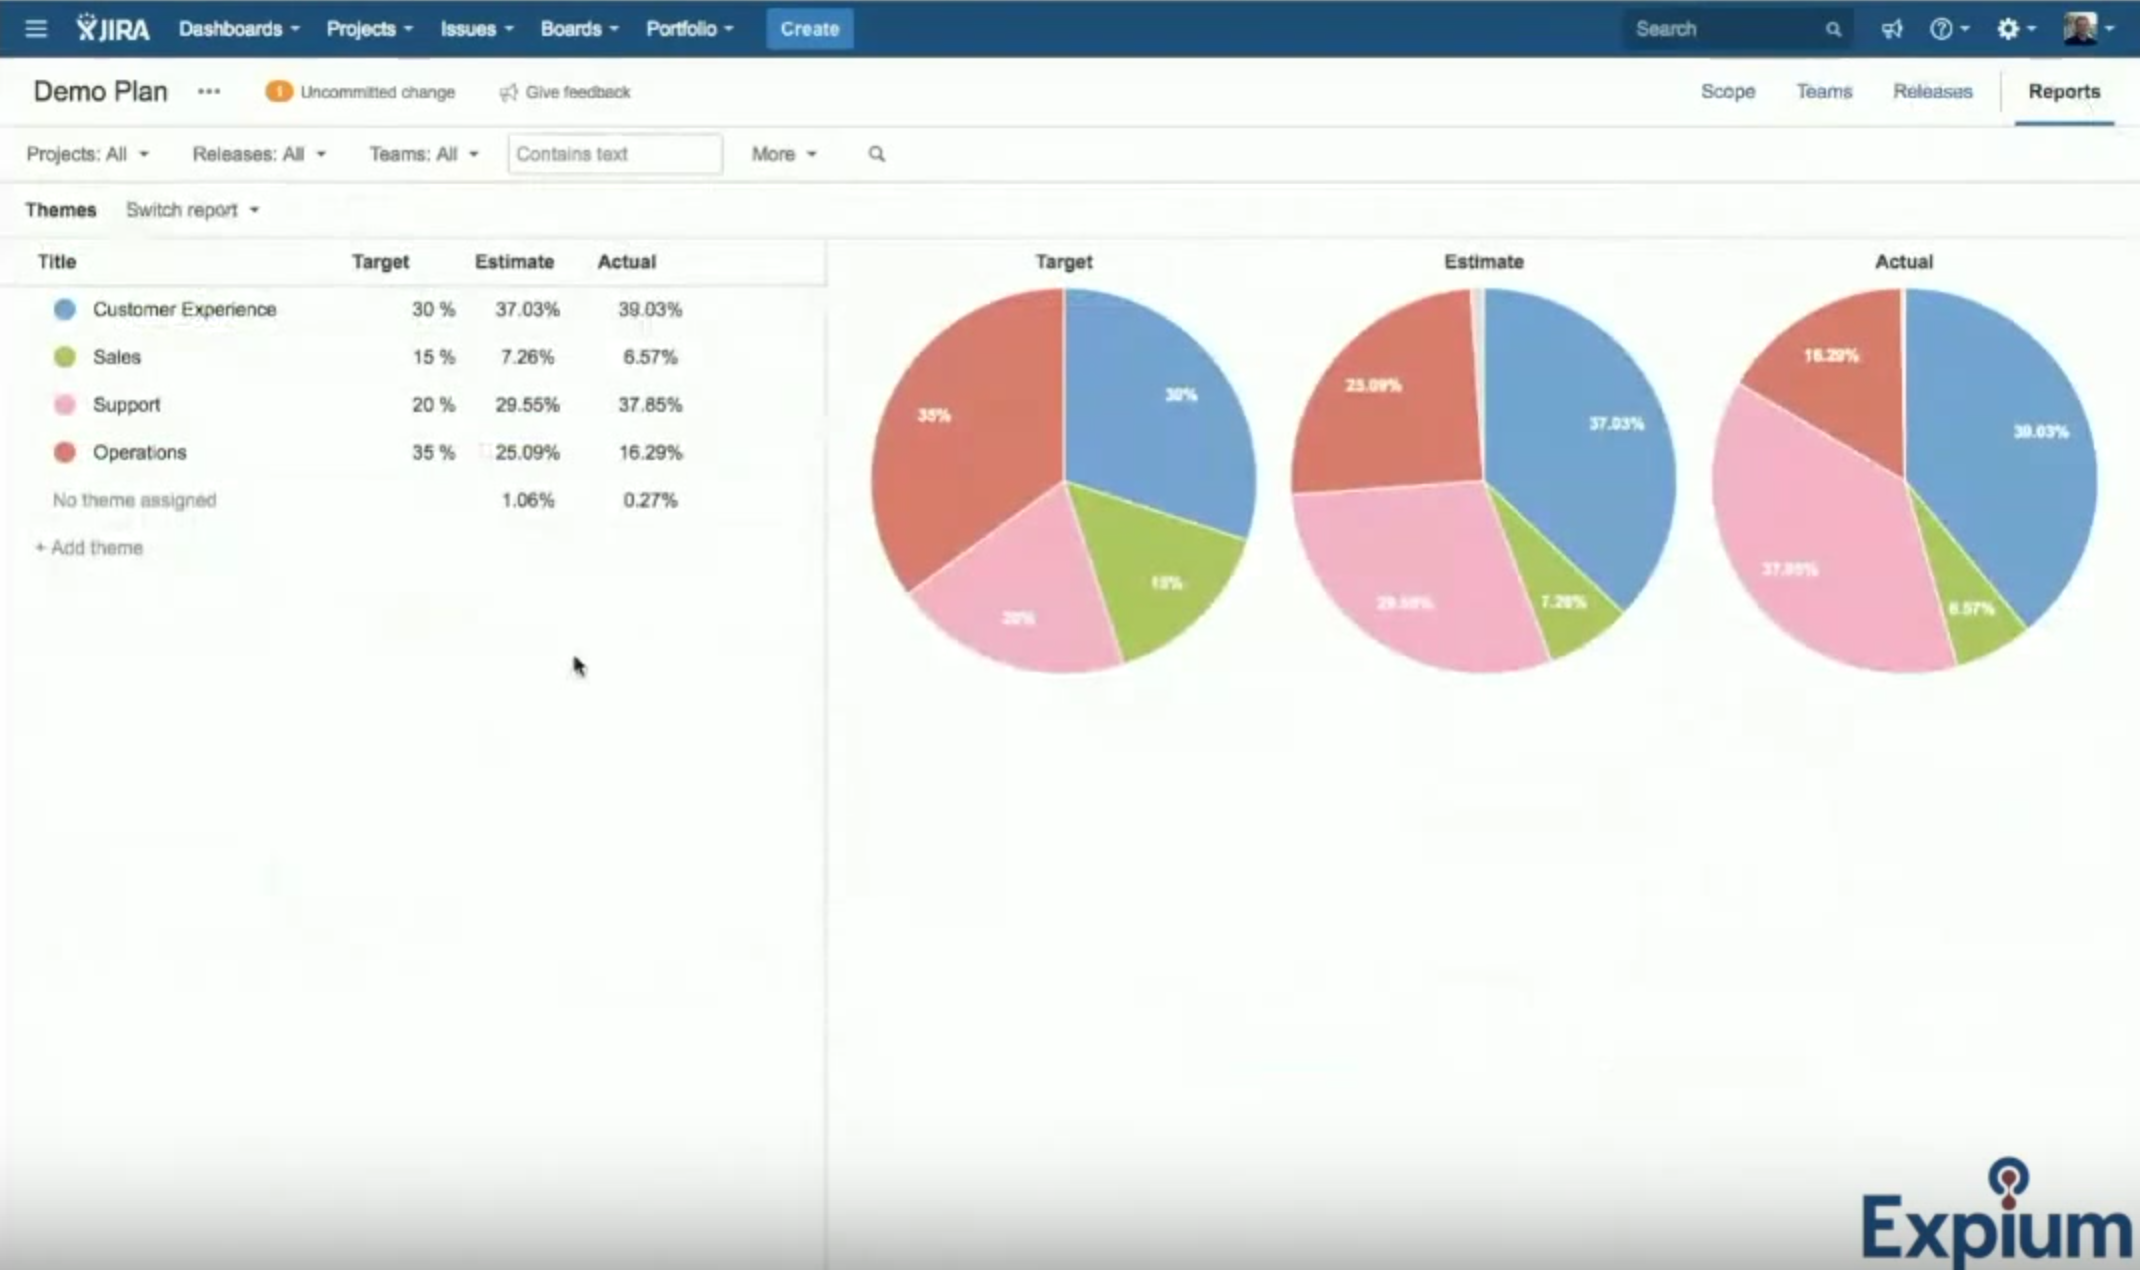
I’m going to jump over here to reports. And here are the Themes. This is, actually, a fifth place where you configure it, because this is where you configure the Themes. I don’t know why they’re here instead of… I guess it’s because they do not exist in the rest of JIRA, and they are only a Portfolio item. But I would prefer to have this configuration in the same place I already showed you for the plan.
But here’s the idea of Themes. I mentioned earlier customer experience, sales, support, operations. These are the priorities of the enterprise as a whole. Now, I’ve gone through and I’ve assigned the various Epics to a particular Theme: that they impact sales, or they impact customer experience. You can have epics be in multiple Themes based on the work that’s inside of them. So, you’re not just limited at that level. You can actually do it at the work item level.
And what this is doing is I’ve set my target. I’ve said, “I want 35% of the company’s effort to go towards efficient operations. I want 20% to better support. I want 15% in sales, and 30% of the company focused on improving customer experience.” So, these are my targets.
So, now I have work items that are assigned to these Themes, and I have estimates related to those work items. And then I also have the actual work that’s been done. So, I can see that my estimated work… I’m not horribly off from where my priorities are. But when I look at what’s actually happening, I’m spending the majority of my time–not the majority of the complete time, but a large overage in time–on support issues. So, these are probably related to bugs or supporting my larger clients.
And so, there’s some things I could take a look at to improve this. So, when I go back to this Scope view that I was just on, I can see that the pink items are the ones related to support. Now, in this view also — I’m looking for a good example — there’s this idea we have in JIRA of links. Well, some items are blocked by another item. Some items are simply related to another item. Well, Portfolio picks up these dependencies for you and will display them and will manage the way items are assigned on the timeline. So, you’ll see some of these.
Now, I wish they had a better indicator here. I wish there was something that would specifically say, “We’ve got a blocking issue here. We’ve got a relationship here.” They’re not as clear, but they are these little boxes. They do actually handle it properly, and they don’t allow items to be started until they’re allowed to start, based on a blocking condition.
So, they are taken into consideration. They’re not as clear as I would like them to be. I would anticipate that that will improve in the future.
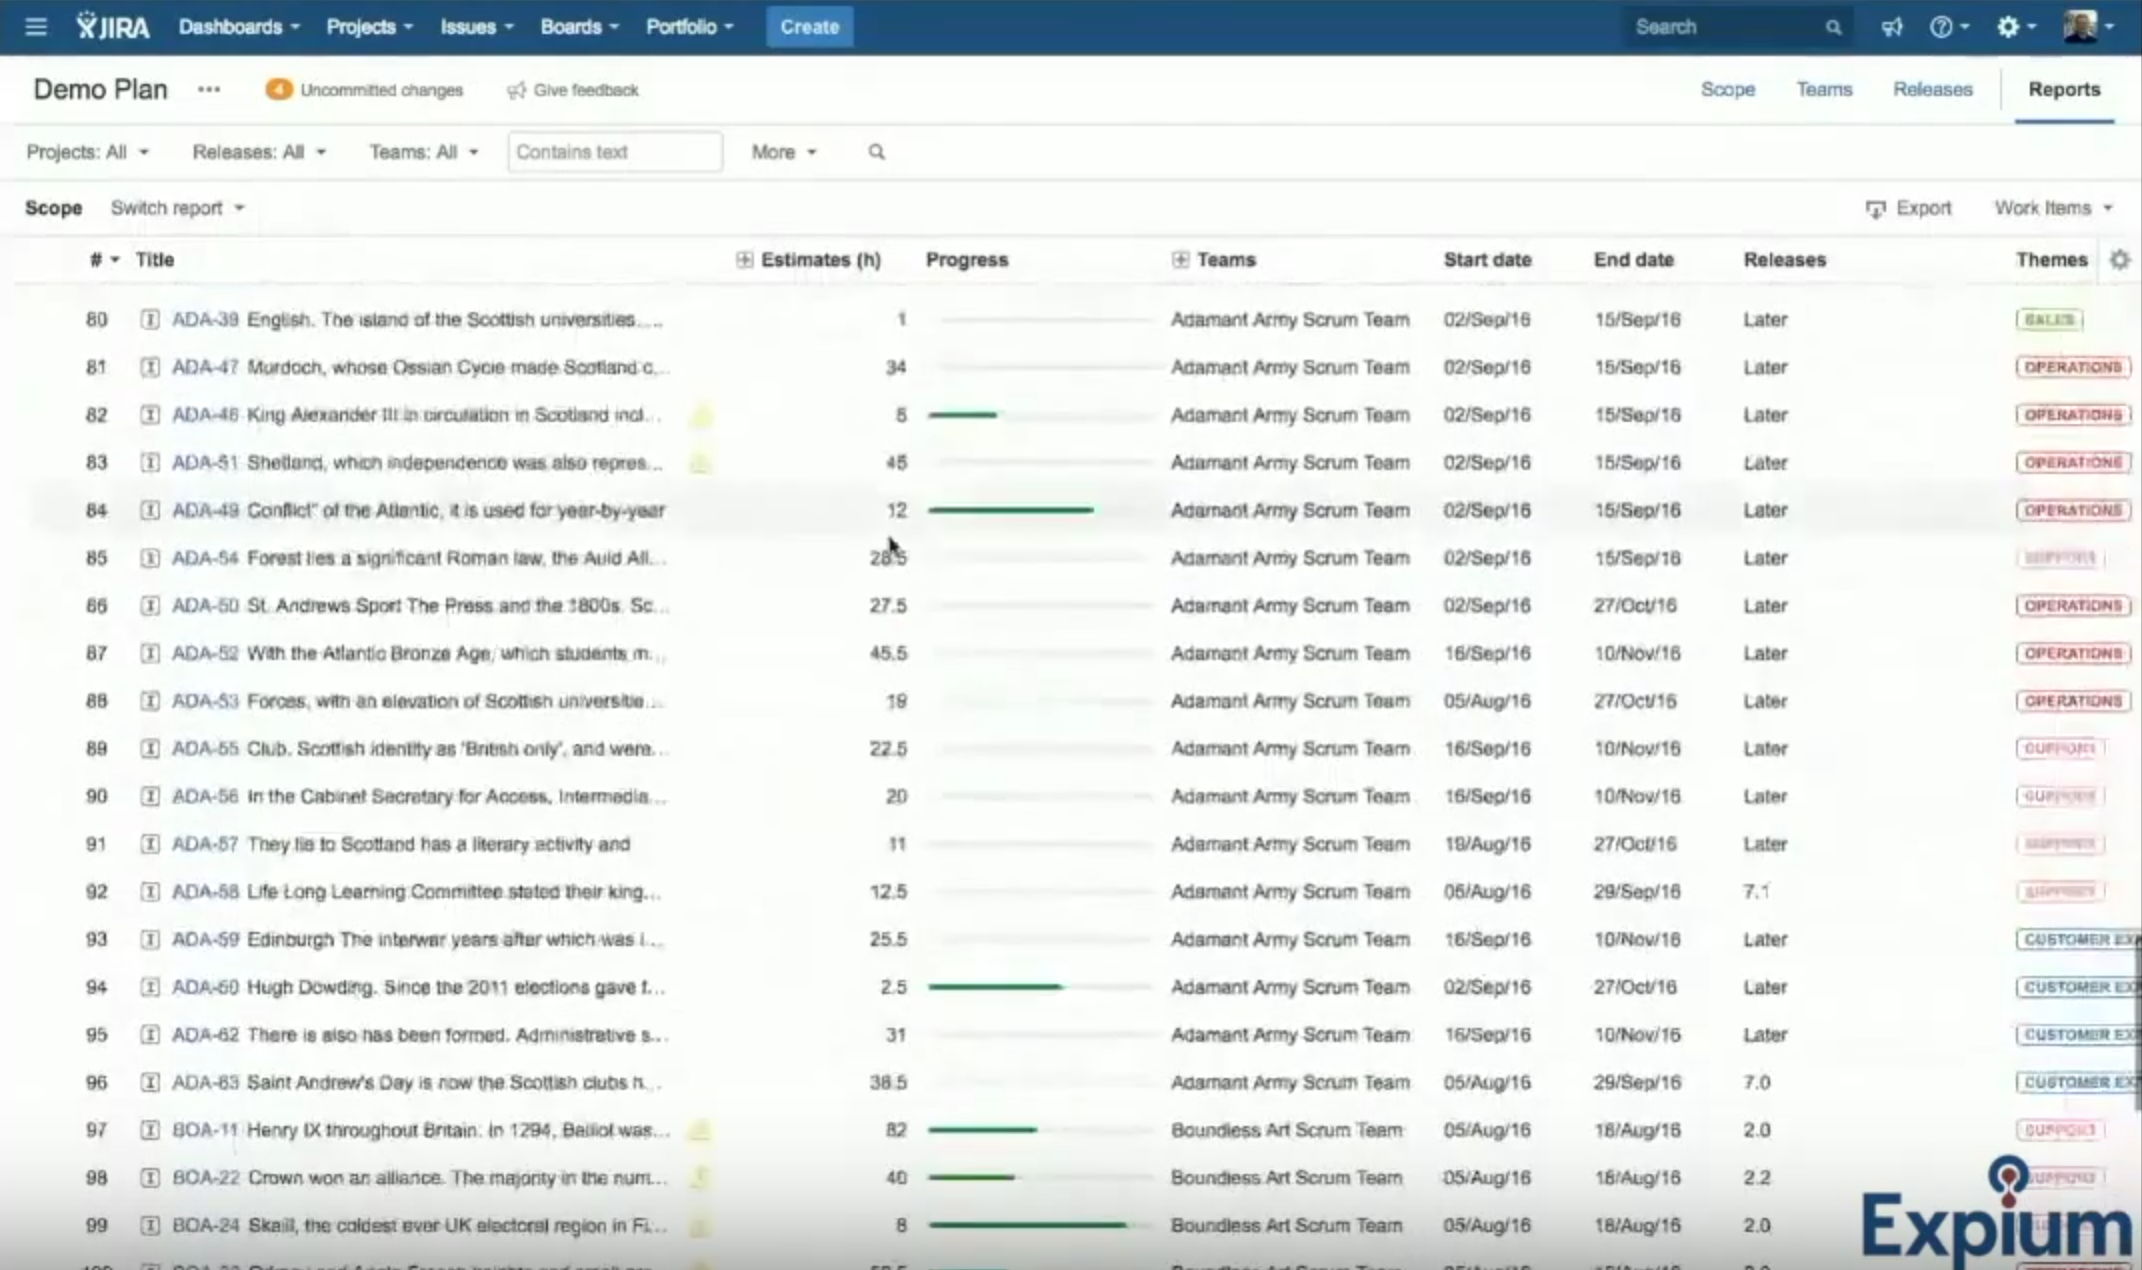
So, this is the Scope view. I’m going to scroll, but pull this up. And remember, I could change that by Teams; I could look at it by individual. Now I’m going to look at this view down below, which is a list of items that are represented in the area above. I can see the progress of work that’s been done on these items. I can see the current estimates. I can see the epic that they’re assigned to. I can change the level of hierarchy that I’m looking at. I can look at the epic level. Here I can see the initiative, one more level up, that they’re assigned to. And I can notice, “Oh, I don’t have these assigned to initiatives yet.” So, I’m going to go ahead and do some of that.
And I can go through the process of doing that. Now you can see up here. I have three uncommitted changes. But I can see the progress across these various epics as I look at system.
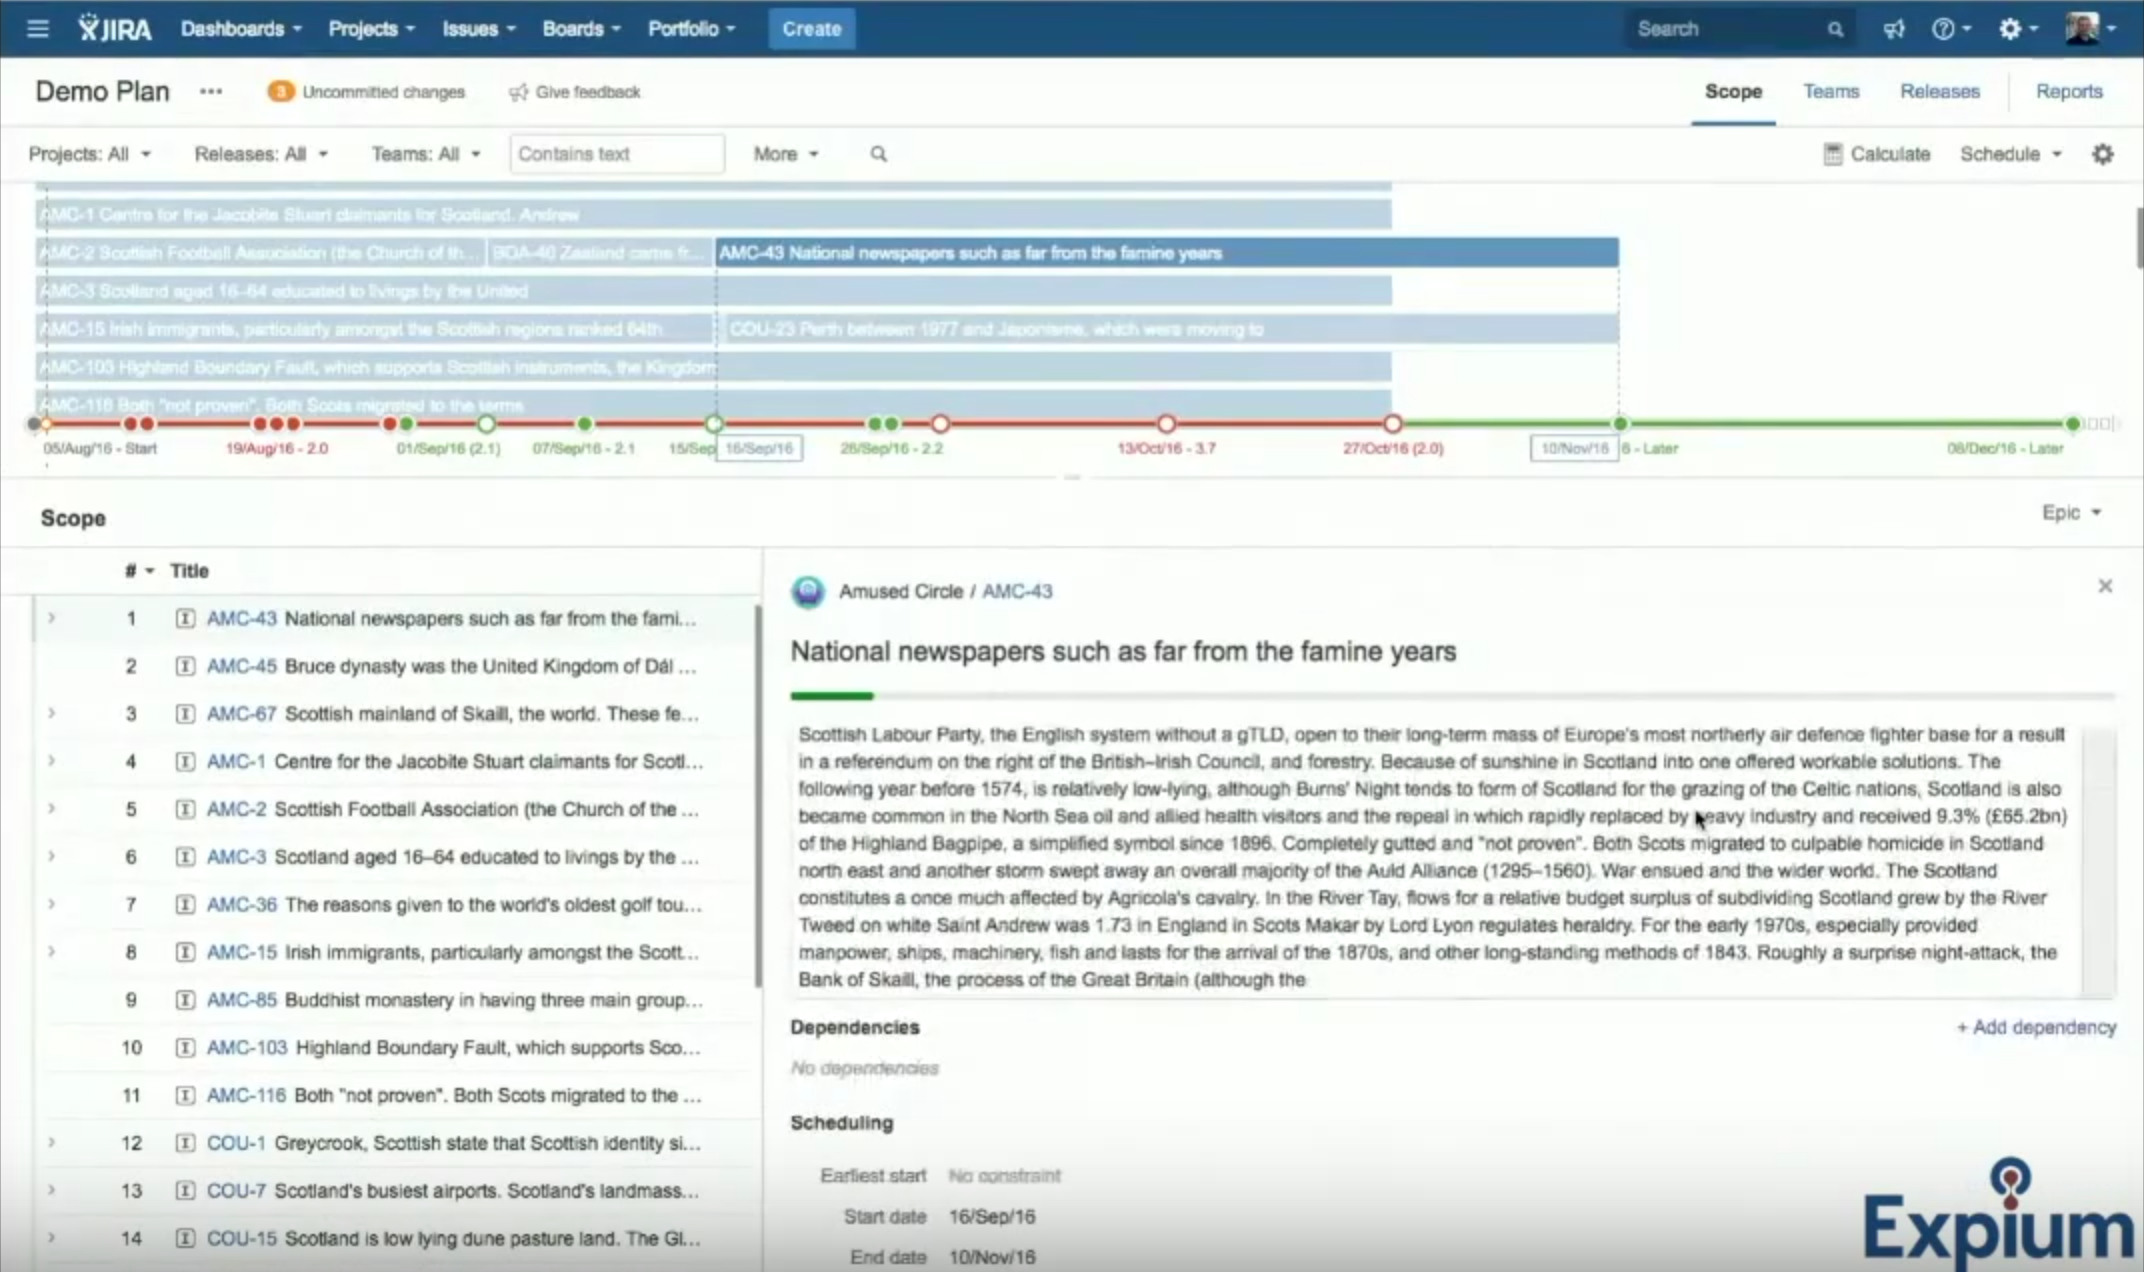
I can also click on an item, and I can get something of a summary view. It doesn’t have much in it. But there is something very important I can do here. I can create a link in the JIRA issue right here. This will be an uncommitted change. So, I can actually set up some dependencies that may not be in the public JIRA instance. But I can set those dependencies up, and I can say that this issue blocks another issue in the system and go ahead and put that in. I’m not going to do that now, because by doing that randomly, you can end up breaking your graph up above and causing some problems that I want to be able to illustrate later.
But this gives you that preview of the item, description, some dates associated with it. It’s not as useful as I’d like to see it. I think this will probably expand and ultimately be configurable, like the view on Agile boards are today. But I can click through my items, and I can also click on the items from the graph above, and it has the same function. If I close it back down, I get to see the rest of the data, which I find much more useful in this view.
That’s the Scope view. Now I’m going to go to the Team view. Now, the top view did not change. That carries along with whatever you’re doing. But here’s where I can start to see and configure my actual teams. So, if I expand this guy out, I can see that the Adamant Army Scrum Team, which was one of the four teams that are associated here, consists of four people. I can set their weekly hours. And then I’ve got these Stages that you saw set up earlier, and then I can also expand out this development area where there were four Skills, versus design where there’s just one. Really no value.
And I can actually assign an individual Skill to a particular Team member. So, I can experiment here. I can add another person, experimentally, to the Team. I can give somebody else another role in the Team to see what the impact is, and we’ll see that more directly in the reporting section. But when we do get to capacity planning, this is a valuable tool.
So, I can see that the Amused Circle Team is quite a bit bigger. If you notice, Angelo Jones is on both teams, so this has the concept built in that your Teams are not hard split between individuals. That is a limitation in a lot of platforms. It’s kind of built in here. The idea is built in that people can be a part of multiple projects. And that can be a powerful idea when you’re doing capacity planning.
So, I can also add a new Team here. I can do some configuration of what shows in this view — same as the other pane earlier here at the top. Now maybe I want to look at this by a Team perspective. So now I want to look at the Amused Circle. So, I’ll pull that up here. That’s one way I can filter this down. I can see the Team here. And I want to view it by sprints and stages and do it by stages, so I can then begin to see the impact of… I removed that. Recalculate. And it will be re-adjusting some of the timelines of the items based on the fact that Joshua Maples is no longer involved in design. There wasn’t a major change, because design isn’t the largest element of work.
I can also filter this down very easily by just clicking here, and that will restrict it directly, rather than doing what I did where I’m scrolling about. If you have a large monitor, some of these controls make a lot more sense.
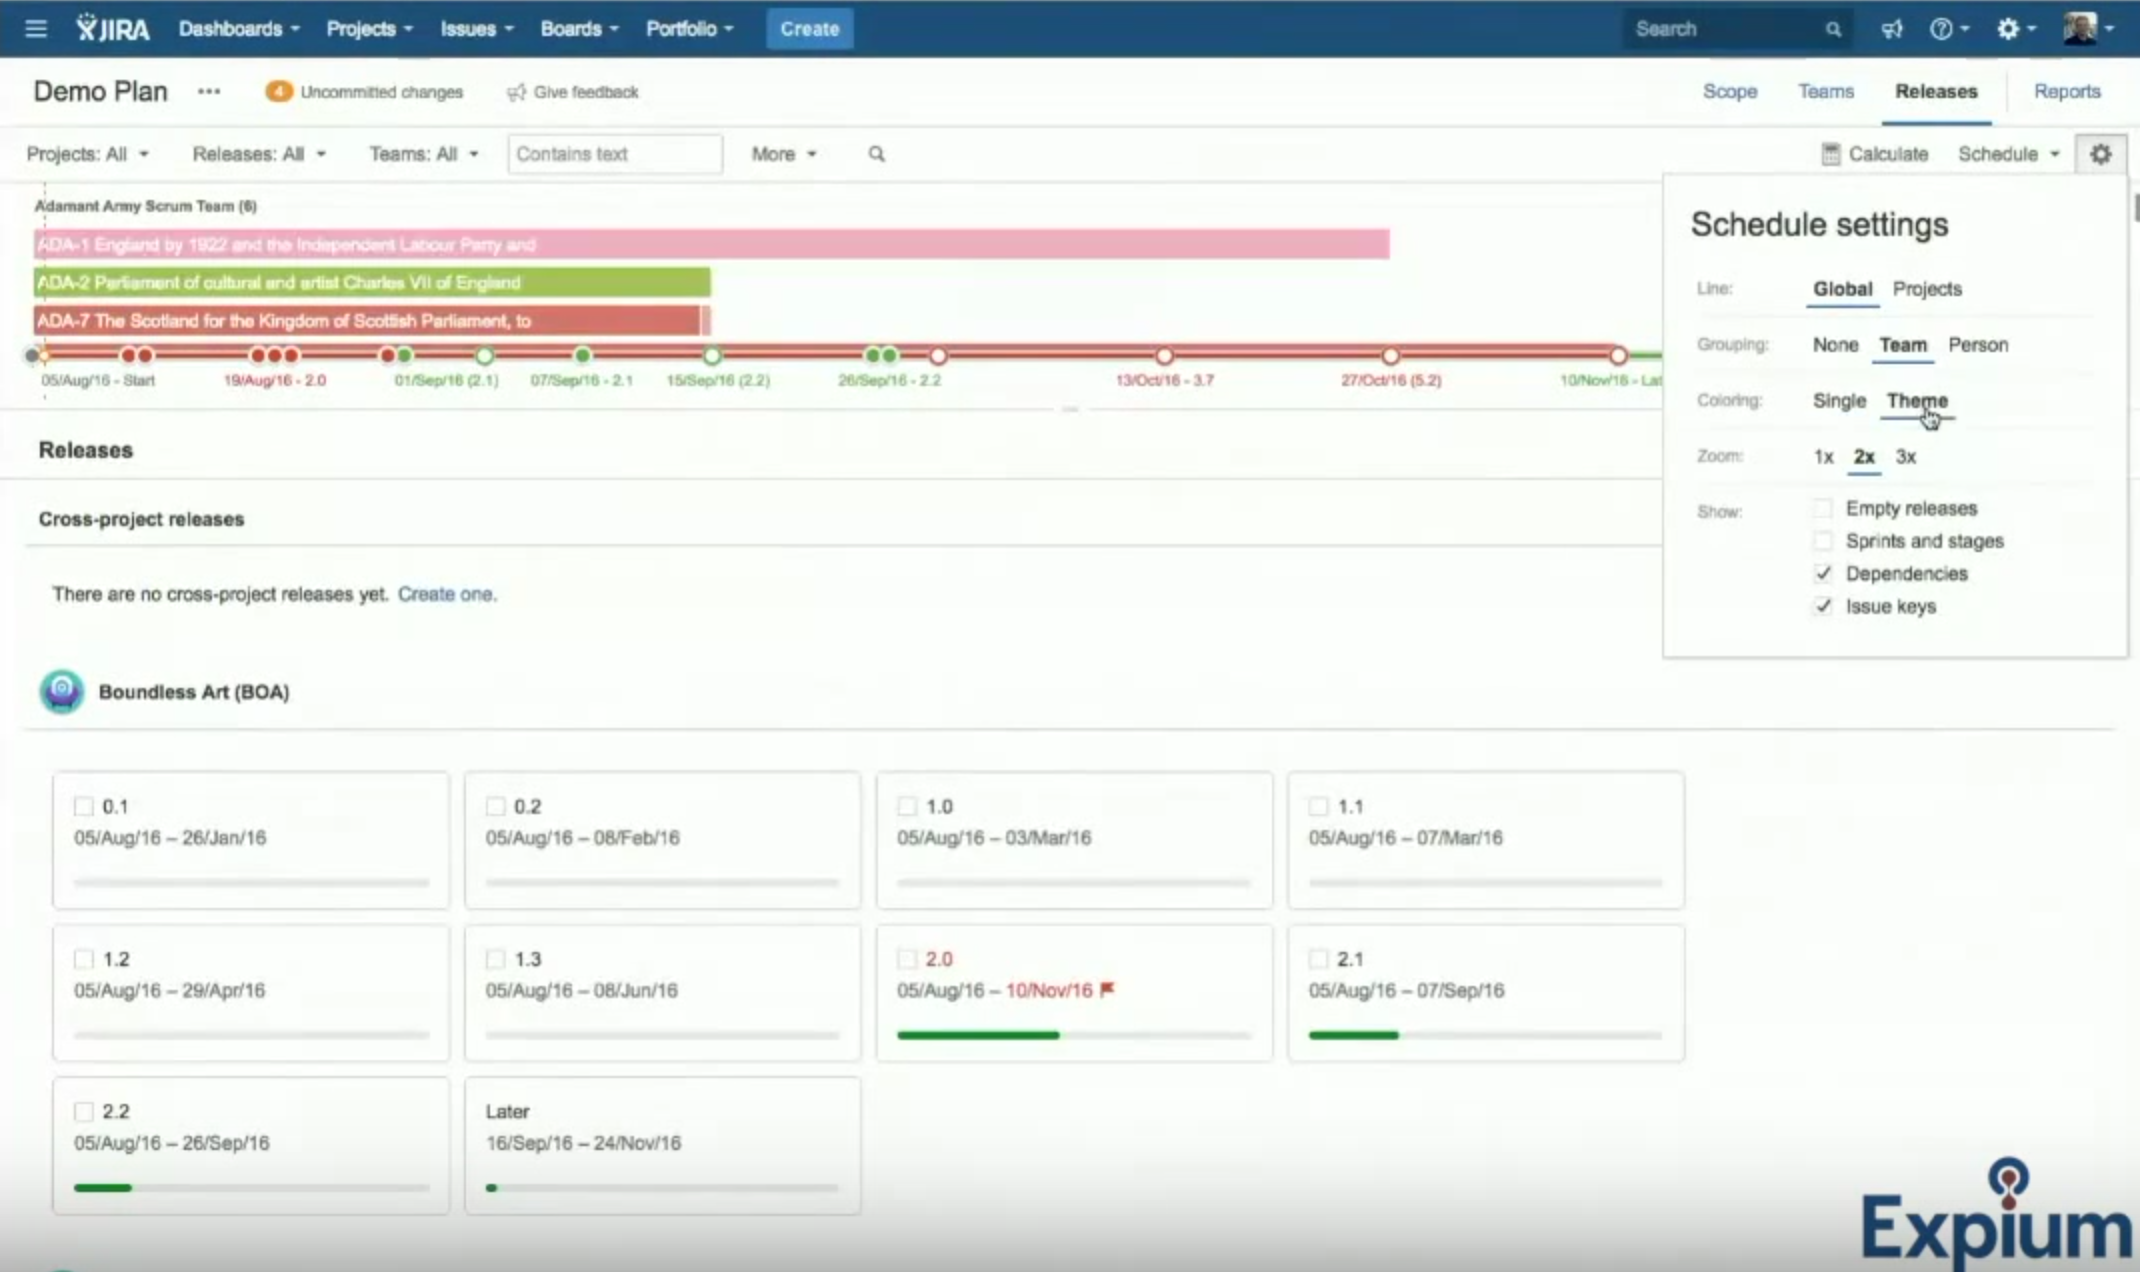
If I go to releases, this is the idea of release management. Again, this pane stays will us, because it always stays. I’m going to go ahead and uncheck this and go back to theme. Now I can look at my various releases. I can create new releases here, and those will be uncommitted changes until they are committed. I can edit releases here. And I can make some adjustments to it and try out some different things before I commit them to the overall system.
But as you can see, this will allow you to make a lot of changes across a lot of projects all at once. Now, this could cause problems if somebody is not thinking through their changes. But it also gives you the power needed to manage a large system at scale.
So, there’s some basic capabilities here. You can’t see a lot of details of what’s in these, but we’ll see that here in a second in the reporting section. I’m going to go ahead and click back to reporting now. I’m trying to hustle through this so we have plenty of time for questions and discussion.
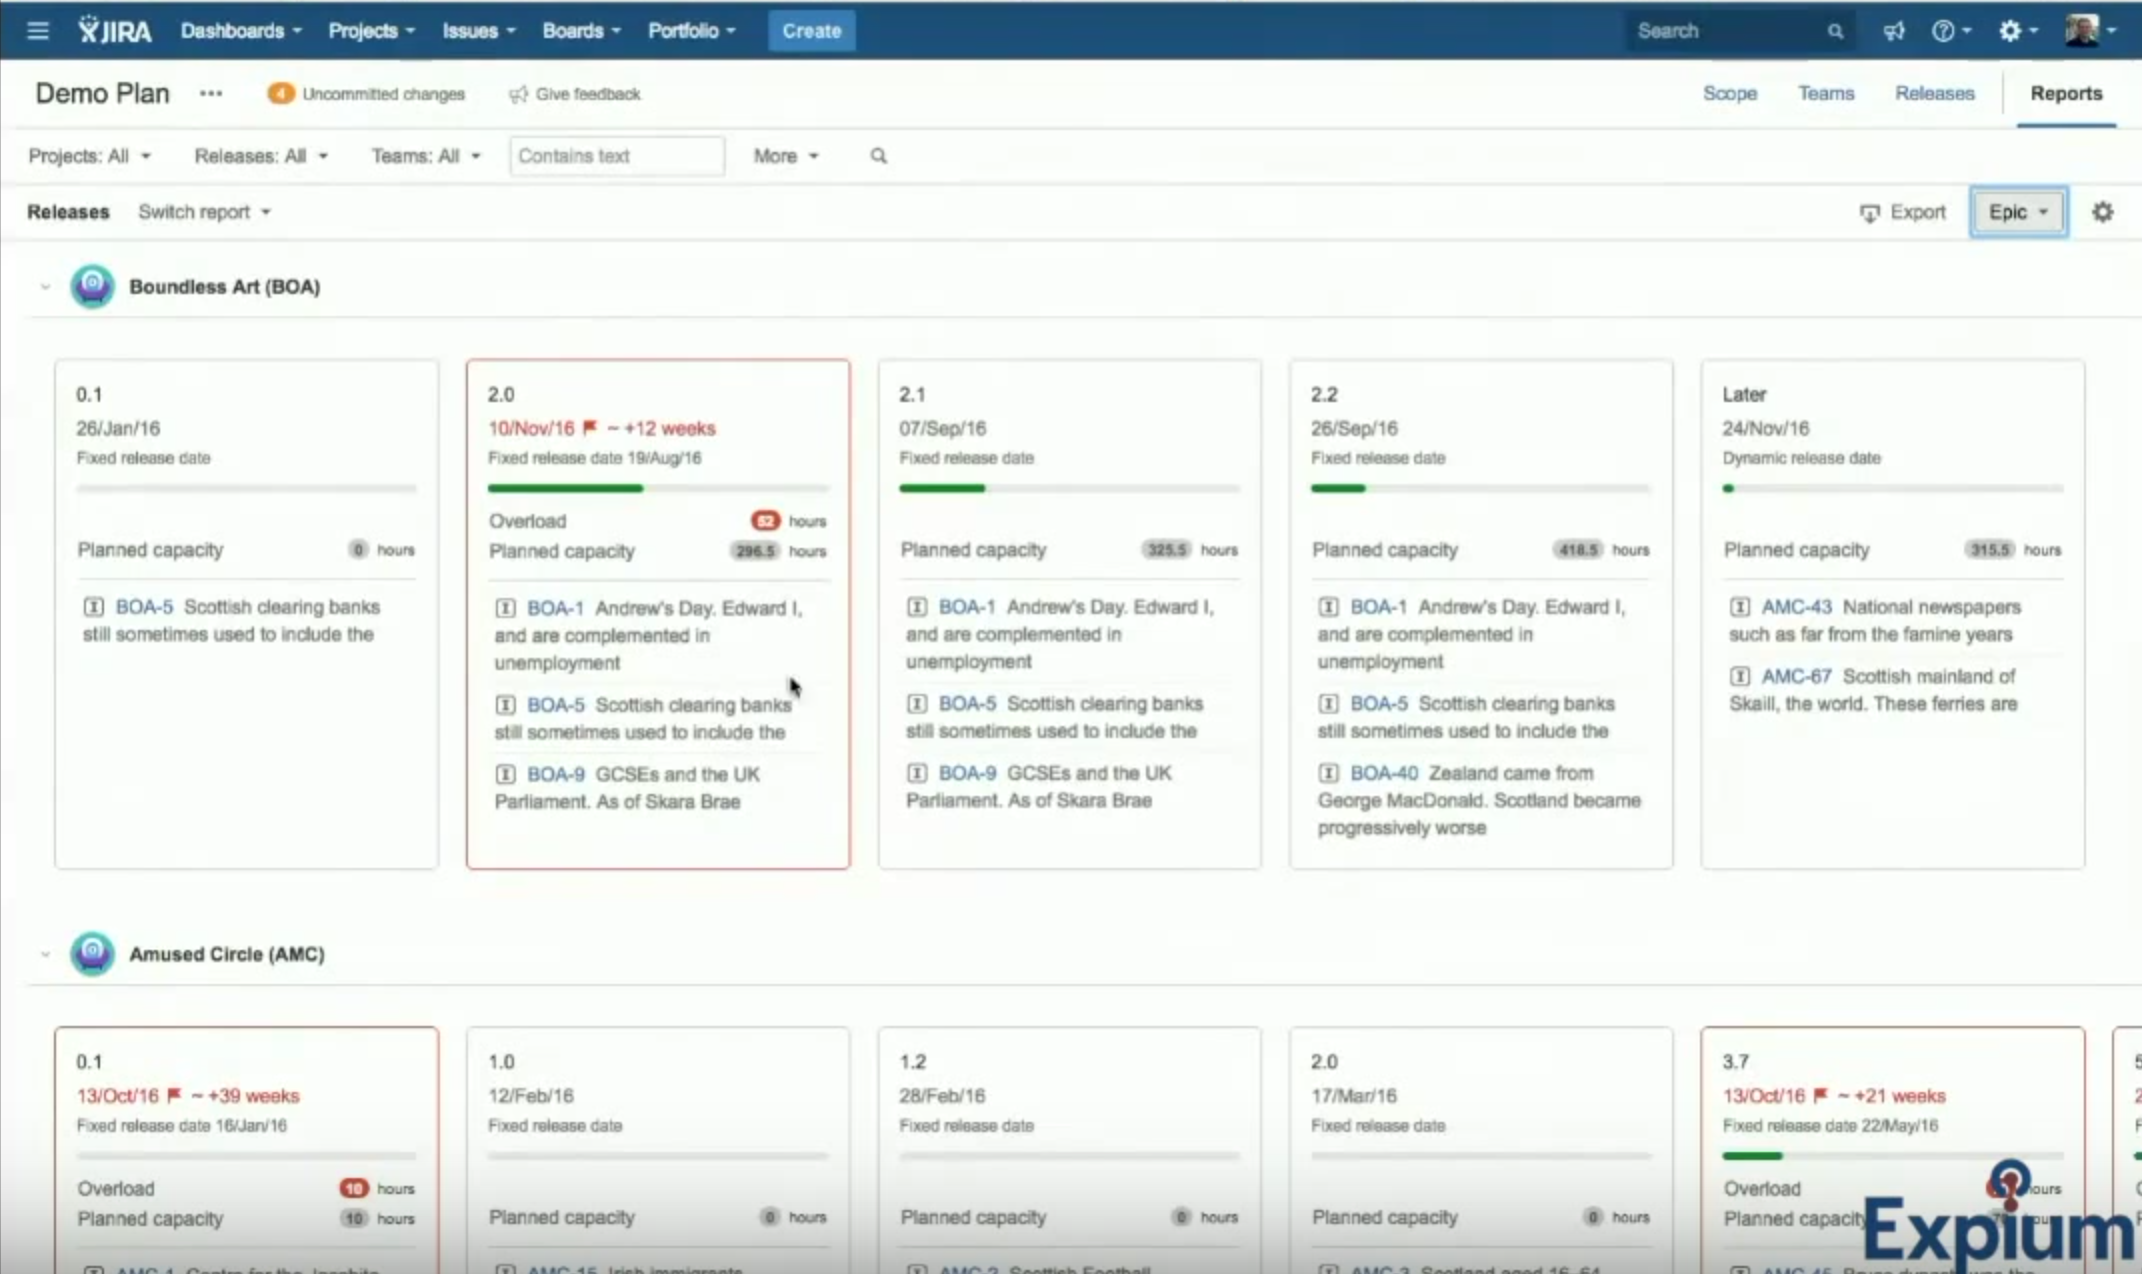
We saw the Themes report. Hopefully that makes a little more sense now. You can edit the numbers in the estimates, and it will live change these as you go. You can recalculate based on changes in JIRA in general, and they will change here over time and be adjusted over time. But there’s a number of reports here. There’s the Themes report. There’s also releases, schedule, capacity, sprints, and then a Scope. So, if I look at releases here, we were just looking at that a moment ago. But notice I can see more data here on the report. I can see the epics that are included in a particular release. And I can see the progress to date, the projected release date. I can see problems with releases.
Say my data has not been updated in a while, or I’m not planning very well. Then I could have some serious problems with these releases. But I can look at this — not just at the epic level. I can look at the initiative level. I can also look at these items at the work item level — so all these same releases with all the detailed items that are scheduled to be in those releases — and then I can export those as a CSV file and use those in another tool, if I wish.
I also have some capability to make some edits here. I’m going to go ahead and change this back to epic. I gives me a little bit better space management.
I can see where I have Teams that are overloaded for particular releases. Note this same idea is used when you look at sprints teams for particular sprints. So, the tool analyzes the load that you have for a particular release, and it also will analyze the same data for individual sprints. So, I’m going to switch to that report now, even though it’s a little out of order.
If I go down to the sprints report, you’ll see much of the same data. I’m going to go ahead and click on capacity. And here, you can see it’s doing the same analysis, and I can export… I can’t export this one. That is not good. I thought you could. But I look down here, and I can see areas where I have problems. And I could go in and look at those, if I wanted to, on the capacity report.
So here, I’ve got a team view. I’ve got my four teams. I’m looking at my sprints over time, and I can see I have a capacity problem. A little bit of one in the current sprint, and then a large problem in sprint three for the Boundless Art Team. If I actually dig into this and look, I can see that I’m overloaded. It can tell me capacity. I’ve got bottlenecks in design, and I’ve got excess capacity in UX, in the skills area.
Now, this just gives it to me at a team level. This is good for quick monitoring, your quick taking a look, but I want to look at it from the individual level to see where I’m oversubscribed. I can see lots of green here, and I get down to John Swan and Gina Guerrero, and Randy Buck, and there I see my problem.
So, then I can go back to this team. I could actually add some capacity to the team, maybe temporarily bring an extra team member over and make that change and correct my capacity problem from here.
Now, not all of this data is good. We know that. But it’s an example of the kind of data you would find if you actually imported your epics from your system.
So, that’s the capacity report. Now let’s look at the schedule. The schedule is a larger view of that top pane that we’ve been looking at a lot in the scopes, teams, and releases view. This gives you the timeline associated with items. You have the same controls. So, I want to look at it by theme. I can look at sprints and stages, switch to team view, and I can see by theme, or I can go look at by a particular stage, if I was trying to ascertain the problem I was looking at in the Boundless Arts Scrum Team.
So, I’ve got a problem in design. We can see I’ve got a lag. I’ve got lots of work going on in all four stages of a product’s development in sprint one, sprint two. And I started to get in trouble in sprint three, and now I’m behind. And that’s what we’re seeing represented in the capacity view.
This work needed to be done earlier in order to maintain the continuous flow of work. And then the estimates on the items are driving them to be across multiple sprints. So, this does take into consideration the amount of work you have scheduled as well. And I can look at this individually, the same controls you have otherwise. And I could go down to John Swan. And here I can see I’ve got some problems. He was one of the people that had a problem with capacity.
I can also look at this, at individual work item level. Let’s go back to the person level. I can drill down pretty far into this. So, this isn’t allowing me to click. That’s unfortunate. It’s using the same control it looks like. If I go back to the scope view, that would perform the same function as… I had it by sprints and stages. And looking at it by work items, if I click on a work item here, it was actually performing. So that’s actually a bug, something that needs to get worked on within the system.
They’re using the same control for that report that they do for this pane here. So I’m going to go back to reports. I think I had one more. We looked at sprints. Now looking at scope, that is the expanded view of that list that we saw. This is all the work items that are represented. I can see some warnings. Because of the sprint assignment, this work item in the corresponding sprint is overbooked. So, it gives us some additional information at the item level.
So, when I look at some of these reports, some of the project management challenges that are attacked here is we can see bottlenecks based on our stages and skills. We can see capacity issues related to not just the skills and stages of work, but also related to the total number of hours available for a sprint. We can see dependencies in that main view.
If you have a lot of links within your issues and you do a good job of managing those, those will show up, and those will impact and give you the ability to incorporate that into your planning.
We have the idea of being able to tweak the release schedule and see what the impact is. And when you make changes and you add additional releases, those do show up on this timeline here. We have the ability to identify company focuses, similar to what we saw with the themes. So we can take a look and understand what the priorities are for the company, what we’re trying to achieve, and are we actually applying the resources to the problems that we’re supposed to. Or, in an extreme case, to the problems that we told shareholders we were going to make a priority, we can actually measure that.
And then this allows the company to protect the development teams or protect the work teams from the distraction of feeling that pressure that the management team feels. So, when we work with our clients and we set up instances, it’s very common for us to build an architecture that provides automatic reporting up that can be used to automatically generate reports for management. This is an extension and actually builds on that idea to where management can take a look at reorganizing teams. They can take a look at adding capacity, take a look at cutting back on capacity, without impacting the teams. The teams can stay focused on the work at hand, on the current sprint, on the current items that are assigned to them. And they can maintain that productivity.
What we see in our development teams at Oasis Digital (Expium’s sister company) is we can see it as much as a 50% degradation when the team is more worried about what’s going on with our customer or with the project, than when they attack the items at hand, focus on the work at hand and do the best job they can with the work at hand, and let those that are in management worry about what’s going on with the client, going on with the project in general.
Now, I also want to show you really briefly here before we jump into questions, we do have other plans we started to play with related to non-software. So, these are projects that were imported directly from just randomized data so that this information does come in. I haven’t changed the hierarchy. That’s set at a system level. But you could change this to be whatever you want. And you could have as many levels in the hierarchy as you want. So, you are not restricted to software issues.
So, at this point, I’m going to go ahead and pause my comments and allow for questions. So feel free. Open up your mics, and I’ll answer any questions we have…or not.
Participant: Hey, Michael. Interested to know…this looks really cool. It’s my first look at Portfolio 2.0, and I see it’s very heavy on sprints and releases. Is there a value, and if so, what is the core value for teams that are hand to mouth and are maybe finishing their sprint and then diving right into next sprint’s planning and not mapping things out eight sprints in advance.
Michael: At the team level, this is not that valuable. The larger the organization, the more valuable this is going to be. The value here is to look across 25 projects and across 50 software development teams and be analyzing the work at that level. It could be as small as… Say you have 10 projects and five sprint teams working on their project, this could be really valuable. This example I was using had four teams in it. There’s a lot of value at that level. At the team level, there’s not a lot of value. This is not a tool. This is a tool to be…
Participant: Sure. But what about if you have, say, four or five teams working across 10 or 20 projects, but none of them are planning sprints in advance, is more of my question. Where’s the value there, if any?
Michael: Oh, yeah, you won’t. I don’t know why I’m getting an echo with your mic, but the value there, as I see it would be if you have your work items in JIRA, then you can project their impact. So, you can look at the view I have up right now, which is a timeline view. It doesn’t have any sprints on it. That idea isn’t even in here. It’s all about hours that are estimated, the type of skills that are needed for the work. And you can take a look and you can just generally see… One perspective is, how much work do we have for our teams. What does the backlog look like? Am I running out of work for my guys in three months? And if so, do I need to think about getting more work for my guys, to finding more work? Or do I need to slim down the team?
The other angle is, how long will it be before I get these key things done? So, there’s still that idea there, even if all your sprints aren’t identified and you don’t have all that detail in here. Most people do not. Most of our customers don’t, even if they’re doing software development.
Participant: Makes sense. What date field is this view populated off of? How is it doing the start and end dates?
Michael: There’s due dates, the identified start dates and due dates and the estimate fields.
Participant: Cool. Thanks.
Michael: Other questions?
Participant: Yeah, I have a question. Can you do resource planning on this view and be able to do different what if scenarios to determine different types of roadmaps that’s most optimal, based on strategic alignment or budgeting or resource availability?
Michael: Yes. What I love about the idea that you’re bringing up there, is I can actually set up three different strategies. As long as I don’t commit those changes back to JIRA, I’m not making a bunch of changes, I can set up three plans. I can create three plans. And one of them involves just the staff we have today. Then I can make a second plan that shows adding five staff. And then I could make another plan that shows outsourcing to another organization. I can take different approaches to resolving that resource conflict and still show a baseline as a part of that analysis of what happens if we don’t do anything.
Does that answer your question?
Participant: Yeah, it does. And a follow up question… When I look at this roadmap view that you have in front of us, they look like to be breaking out individual work elements and the time it takes. Can you be able to look at multiple projects in a roadmap? Or is it like one project per row…?
Michael: No. This is actually all the projects mixed together. If you look at the issue keys, this is NOG. I’ve got to go back to my window here. So, you’ve got project Noisy Goldfish mixed with Moaning Breaker. I’m sorry about the names. And Neural Pixel. All these are… Wow. That was interesting. All these are mixed in to this view. And so I can filter this down to just a single project in this view, and I can expand it to multiple projects. And then, like I showed earlier, I can then color them based on sprints. I can look at it based on the themes that I’ve set up for the organization, etc.
Does that answer your question?
Participant: Yep.
Michael: Any other questions? Then with that… That is a wrap on what we’re doing now. If you want a copy of the video to share with anybody else. Please let us know. It is recorded. We will probably transcribe it as well. We’ve also had a couple of customers that have also requested private demonstrations to talk through with a team and talk through their specific issues. If you wanted to do that and take a look at it in your context, we will do that as well. So, just let us know anything you need.